Plotlay Open the app →

Who it’s for · surveyors and field teams

For surveyors and field teams

Take the register or the plan to site on a phone: find each asset, confirm it or record where it really is, capture what is missing, and send the result straight to GIS.

What you can do
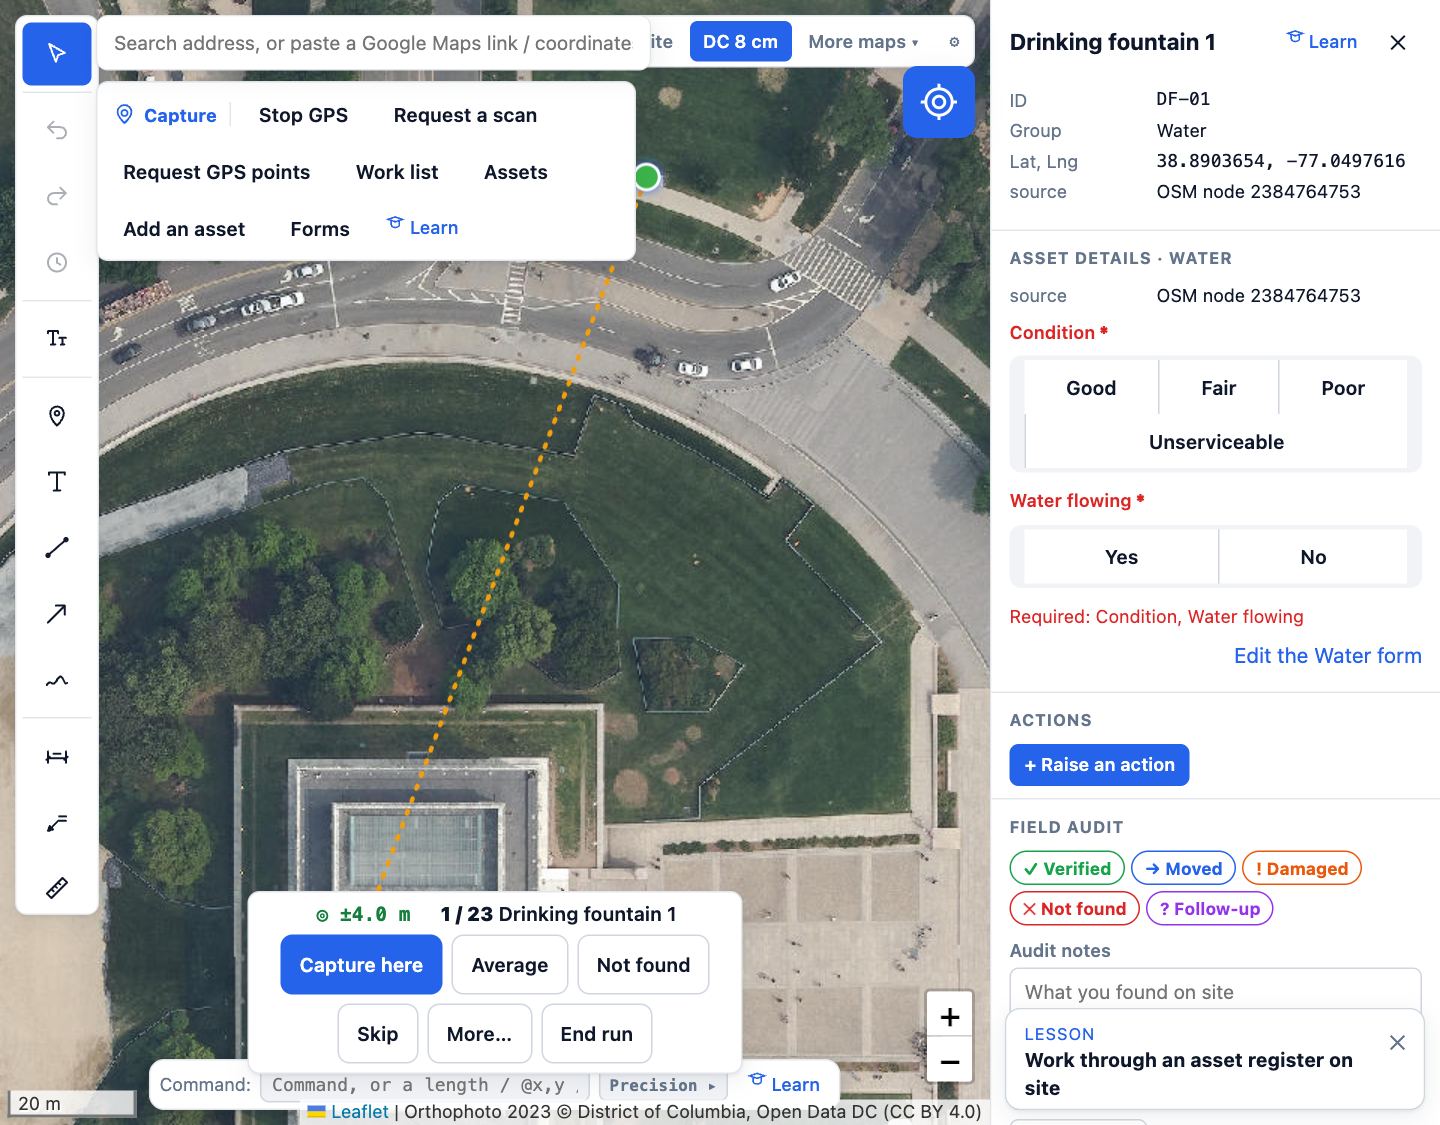
Plotlay on site: the aerial with assets to check, and a drinking fountain’s form with its condition and water flow.
Work the listNearest first, with distance and direction. Confirm, record where it really is, mark it not found, or skip. Barcode and QR tags, forms, condition and photos.
GNSS receivers and accuracy targetsBluetooth and USB receivers that send NMEA work in Chrome and Edge, and each capture carries the fix quality and accuracy. Set a target and anything worse asks first. Not yet tested with every model.
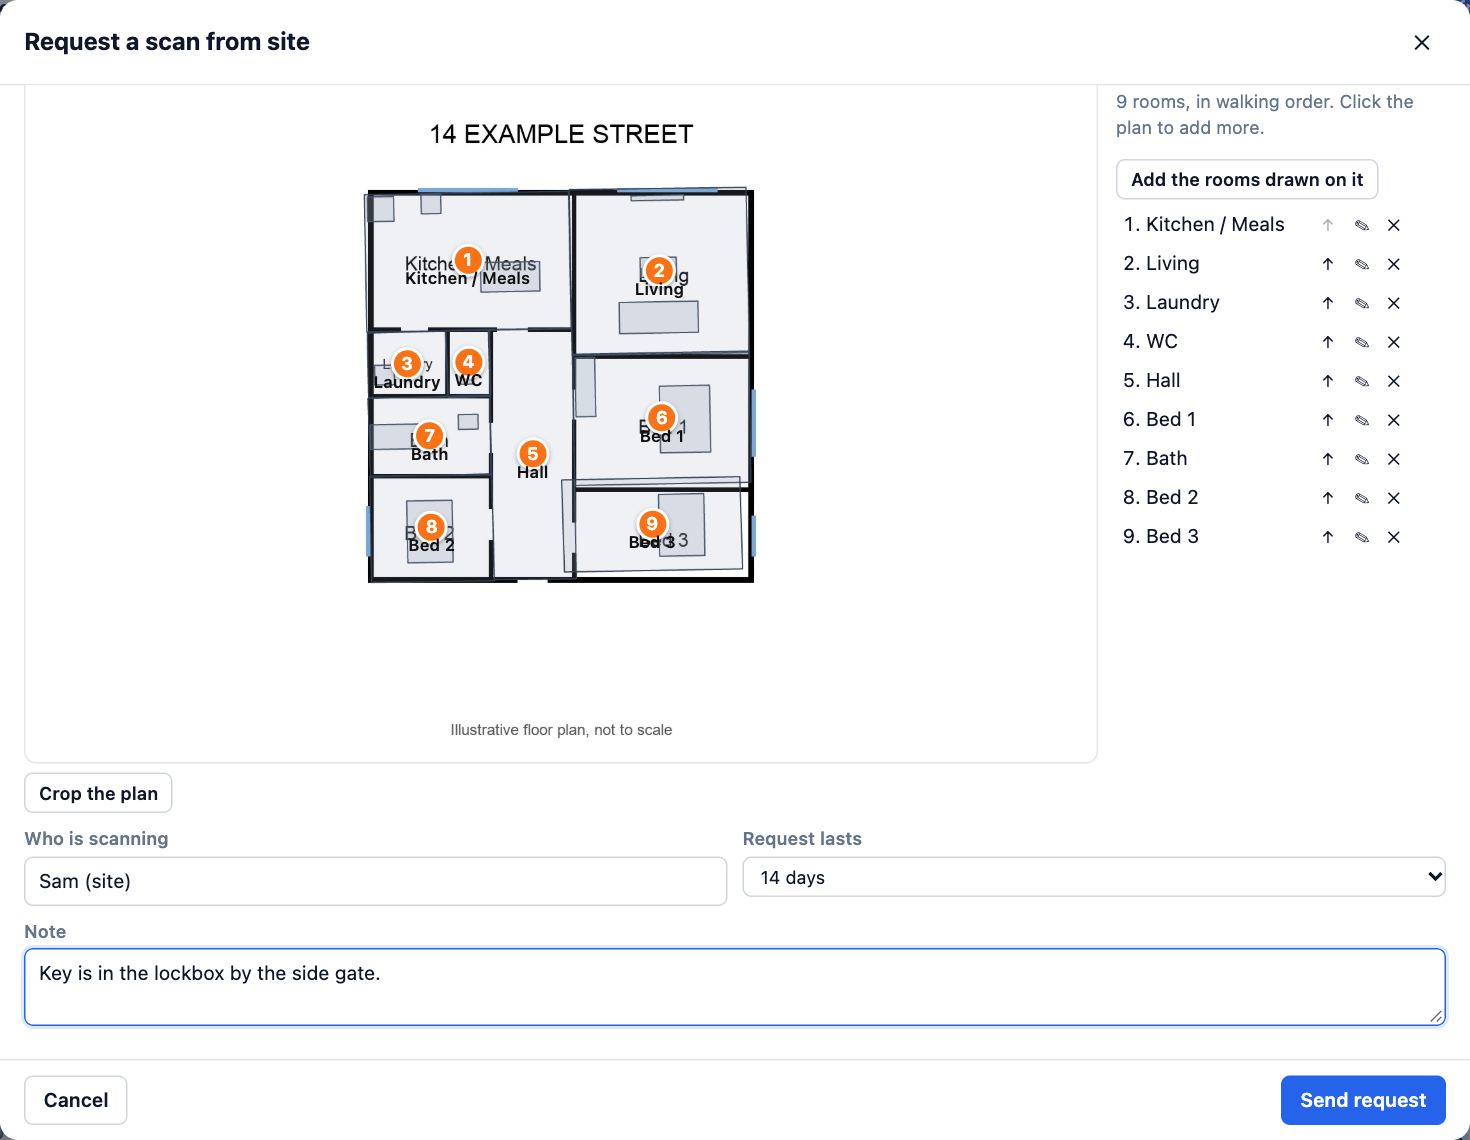
A scan request: a floor plan with its rooms numbered in walking order, who is scanning and how long the request lasts.
Measure rooms with Plotlay ScanThe office marks the rooms; the person on site scans them in order and each lands on the plan at its measured size. Usually within a few centimetres a metre. Plotlay Scan is free for iPhone, iPad and Android.
Download Plotlay Scan on the App StoreGet Plotlay Scan on Google Play
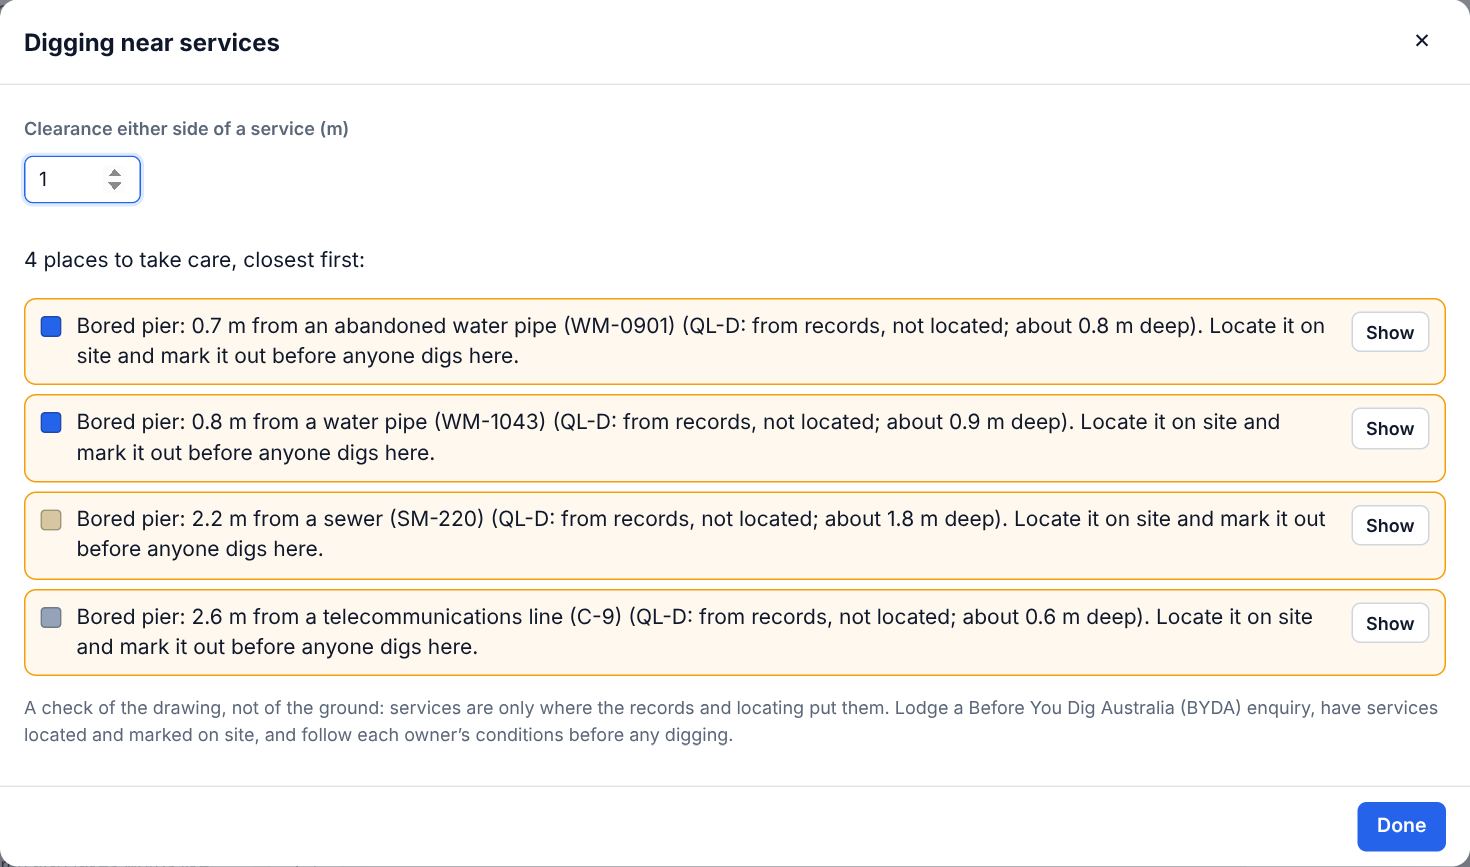
The dig check: bored piers near located services, each with its distance, the service’s quality level and its depth.
Underground servicesImport them from a GIS file in their AS 5488 colours with depth, size, material and owner; mark QL-A to QL-D as they are located, and draw a long section. The dig check is a check of the drawing: have services located before anyone digs.
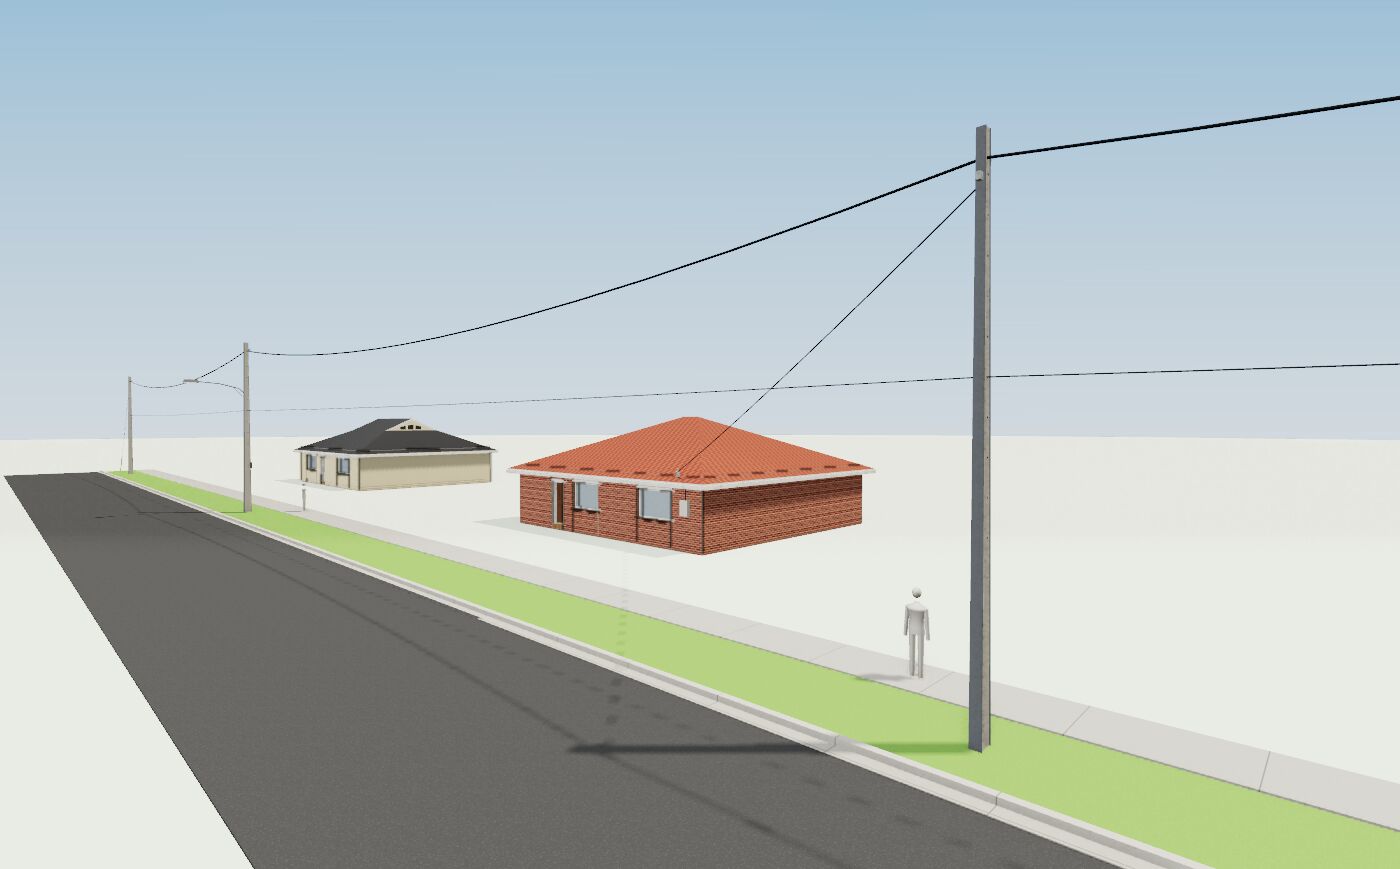
A street in 3D: power poles with conductors sagging between them and a service line to a brick house.
Poles and overhead linesA pole at each point, conductors sagging in 3D, service lines to each house, and clearance zones showing typical approach distances (reference only). Poles join the register.
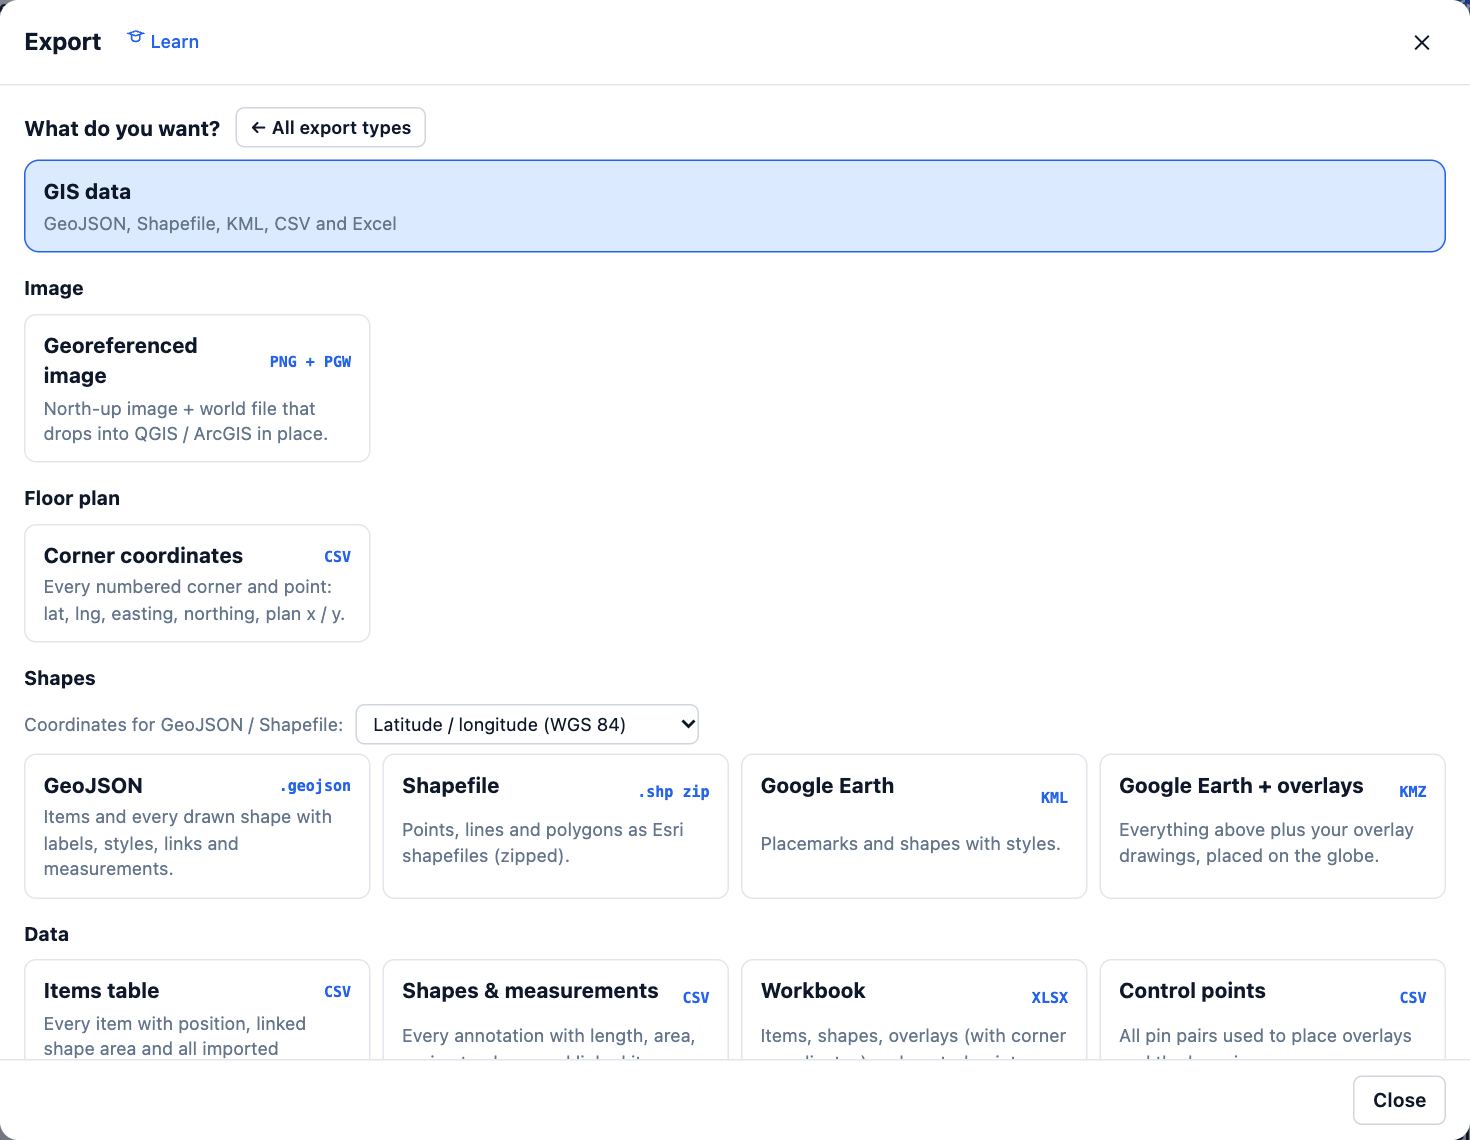
The Export dialog with GIS data selected: GeoJSON, Shapefile, KML and CSV with their coordinate options.
Straight into GISGeoJSON, Shapefile, KML, CSV and Excel in latitude and longitude or MGA/UTM, and DXF in MGA grid. Status, condition, level and accuracy are columns.

How accurate is it?

As accurate as the drawings, imagery and GPS behind it. Each pin on a drawing shows its residual and the fit shows RMS; a few tenths of a metre is typical, a few centimetres with sharp imagery. Phone GPS is good to a few metres; a GNSS receiver does better and records how well. Where law or a contract needs a licensed surveyor, their licence and sign-off are what count, and a surveyor can use Plotlay for their work.

What comes back

idaudit_statusposition_sourcegps_accuracy_mmoved_m
BEN-09Verifiedgps3.11.6
BEN-08Not foundimport
BEN-07import

A real export from the field audit example (items.csv), plus latitude, longitude, group, condition, audited_at, audited_by, photos, level, elevation_m and more. Drop it into Power BI and the map visual plots it.

Learn it

The field path covers work lists, GPS capture, asset forms, offline areas, underground and overhead services and exporting to GIS. Measuring rooms: the Plotlay Scan path. Worked examples: verify an asset register on site and field data into GIS and Power BI.

Also for: Homeowners Builders and designers Facilities and asset teams Councils and developers Every feature →