
Showcase · Data layers · NSW open data
How much ground does each student get?
The department publishes every school’s headcount but not its grounds, so the grounds were drawn in Plotlay and divided by the 2025 headcount. Across 66 compared government schools in inner Sydney and Parramatta, the median primary school has 30.3 m² of grounds per student and the median high school 34.7 m², a little over two car spaces each. The spread runs from 7.0 m² to 223.0 m².

The spread, and the schools tight on land
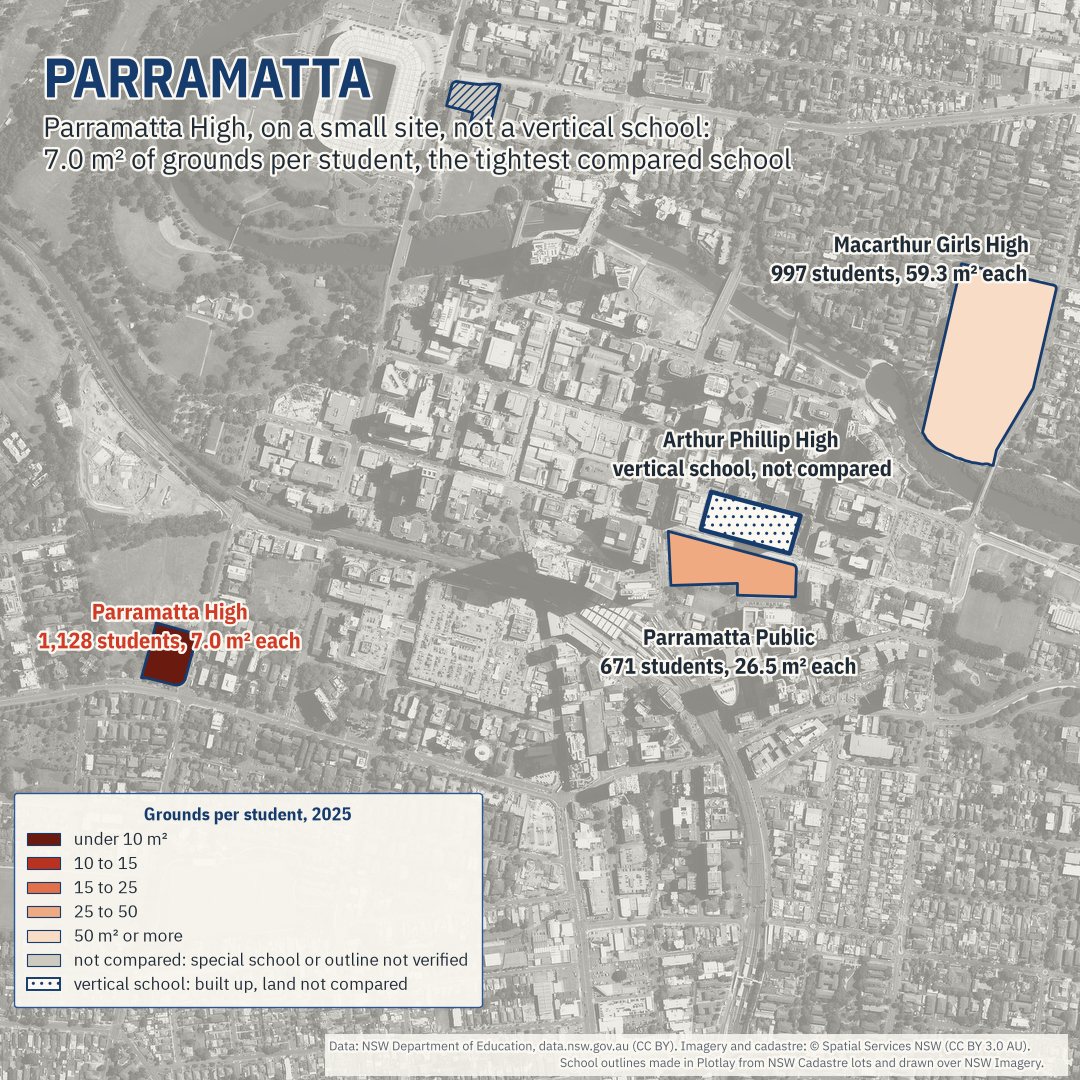
Half the compared schools sit between 21.8 and 47.7 m² of grounds per student. 7 of 66 have under 15 m², and 13 have 50 m² or more. The tightest is Parramatta High: 1,128 students on a small site, 7.0 m² each, and it is not a vertical school. Next come three inner-city primary schools, Balmain Public 10.9 m², Woollahra Public 10.9 m², Ultimo Public 11.1 m², and Mosman High 13.3 m². The roomiest are Daceyville Public 223.0 m² and J J Cahill Memorial High 129.5 m².


Across the 64 compared schools open in both 2015 and 2025, total grounds over total students went from 32.2 to 33.2 m² per student on the same outlines: 25 got tighter and 38 roomier. The land did not move; the students did.
The exception: vertical schools
Two schools here are built as towers on small sites: Inner Sydney High, a 14-storey school in Surry Hills (1,161 students on 5,687 m² of grounds in 2025, built for up to 1,200), and Arthur Phillip High in Parramatta, rebuilt for 2,000 students as the first high-rise public high school in NSW (School Infrastructure NSW). Both opened their new buildings in 2020. Their land per student says how they were built, not how much room their students have, so comparing it with low-rise schools would not be fair. They stay on the map, marked as vertical schools, and are left out of the medians, the counts and the rankings.
Inner Sydney High, a deep dive: why it is the exception, and its estimated floor space per student as a measure of its own.
The map
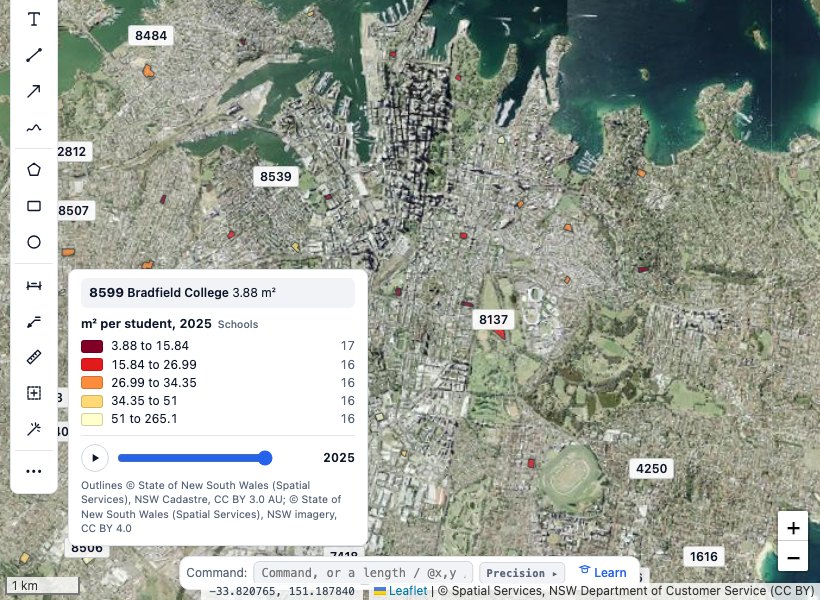
Every school's grounds, coloured by m² per student for the year on the slider. The map opens on inner Sydney, where each school is a circle sized by its students; zoom in and the circles become the outlines. Hover over a school, or tap it on a phone. Grey schools are not compared: schools for specific purposes, and outlines that could not be checked on the imagery. Dotted schools are the two vertical schools, on the map but not compared on land. A new school opens a year group at a time, so in its first years it has few students and a lot of ground each.
New schools open a year group at a time
A new school's headcount climbs by design. Inner Sydney High's went 147, 358, 591, 797, 999 and 1,161 from 2020 to 2025: a planned, staged opening, not a rush of demand. It took Year 7 only in 2020 and added one year group a year until it had Years 7 to 12 in 2025. That is one reason every figure here uses 2025: it is the first year all of the study's schools opened before 2025 have every year group.
The other schools opened since 2015 started the same way. Cammeraygal High took Year 7 in 2015 (98 students) and had Years 7 to 12 by 2020. Anzac Park Public (2016) and Bayanami Public (2019) took Kindergarten only in their first year and Kindergarten to Year 6 the next. Green Square Public opened in 2025 with Kindergarten to Year 2 (107 students) and reaches Year 6 in 2027. In 2025, 3,556 students were at these five schools, 2,893 of them in inner Sydney: that is where students are now, not a measure of demand.
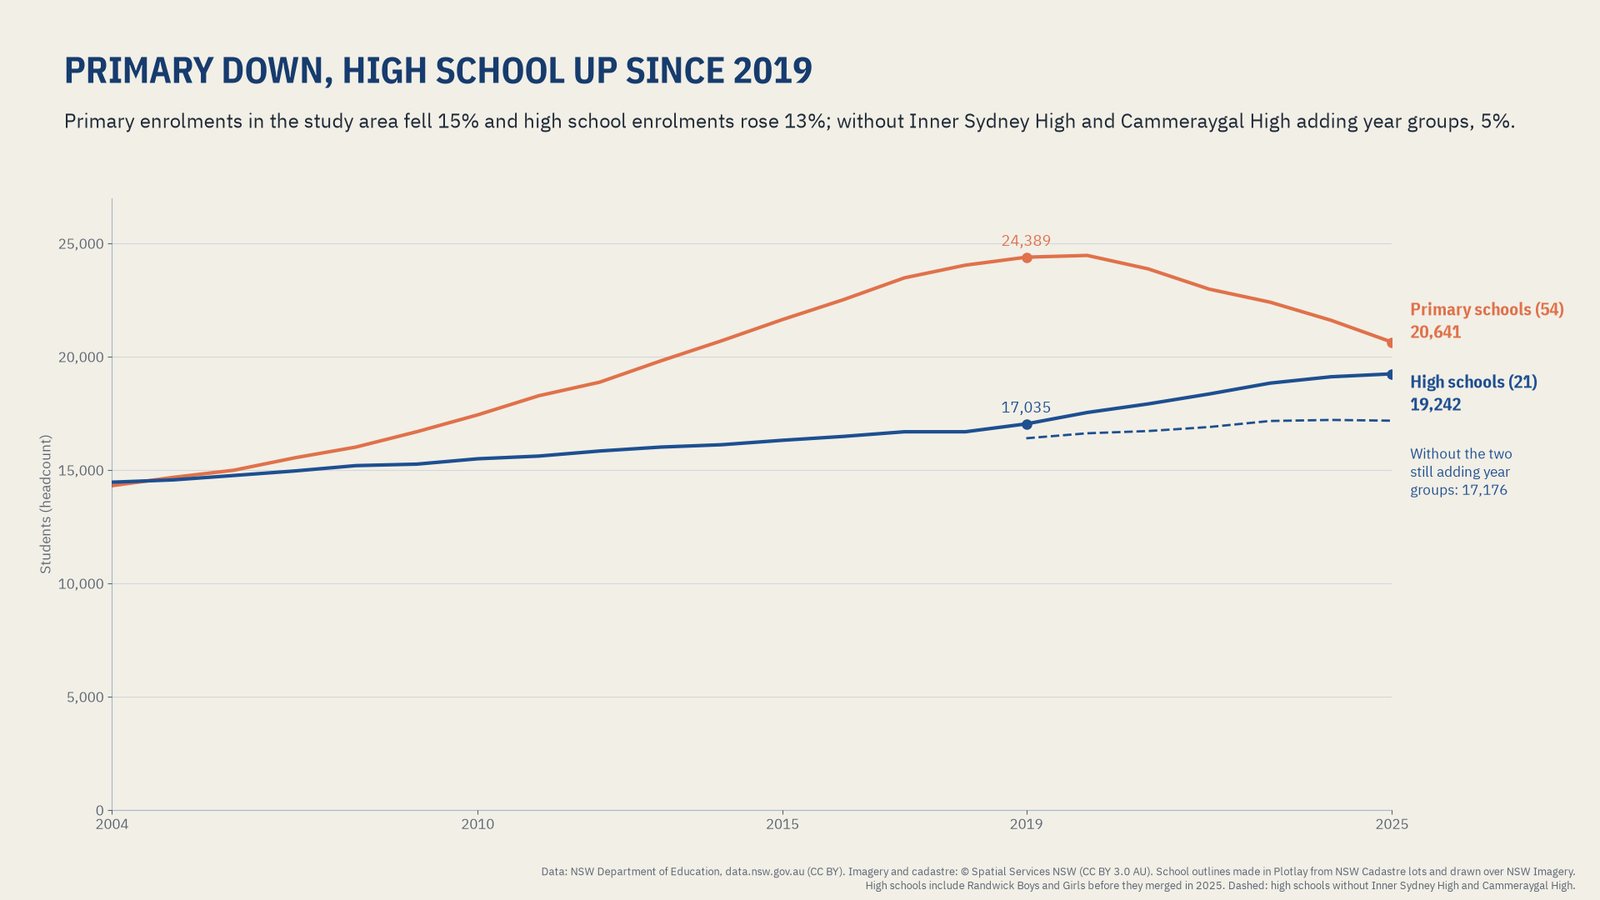
Since 2019, primary enrolments in the study area are down 15.4%. High school enrolments are up 13.0%, but 1,431 of the 2,207 extra students are Inner Sydney High and Cammeraygal High adding year groups; without those two, high schools rose 4.7%.
How it was made in Plotlay
The department publishes a code, a name, a location and 22 years of headcounts for each school, but no grounds. Without a shape there is no area. Making the shapes took one Plotlay project and these steps:
- A map on the NSW aerial imagery and a data layer called Schools (Data layers, in the Site workspace).
- Pick the lots. Land lots: a click asks NSW Spatial Services for the cadastre lot there, and the lots clicked one after another join into one shape. 75 schools were made this way, up to 61 lots each.
- Draw the rest. 6 schools have no lot of their own or share one with another school, such as Sydney Boys High and Sydney Girls High on one Moore Park lot. They were drawn over the imagery.
- Key each shape by its school code, so it joins to the department's tables.
- Link the tables: one row per school, and enrolments and attendance by year. The match report showed every code matched.
- Colour by m² per value (the area divided by the students) and step the time slider from 2004 to 2025.
- Export GeoJSON, TopoJSON for the Power BI Shape Map, CSV with WKT for Azure Maps, the joined data and a Python starter.
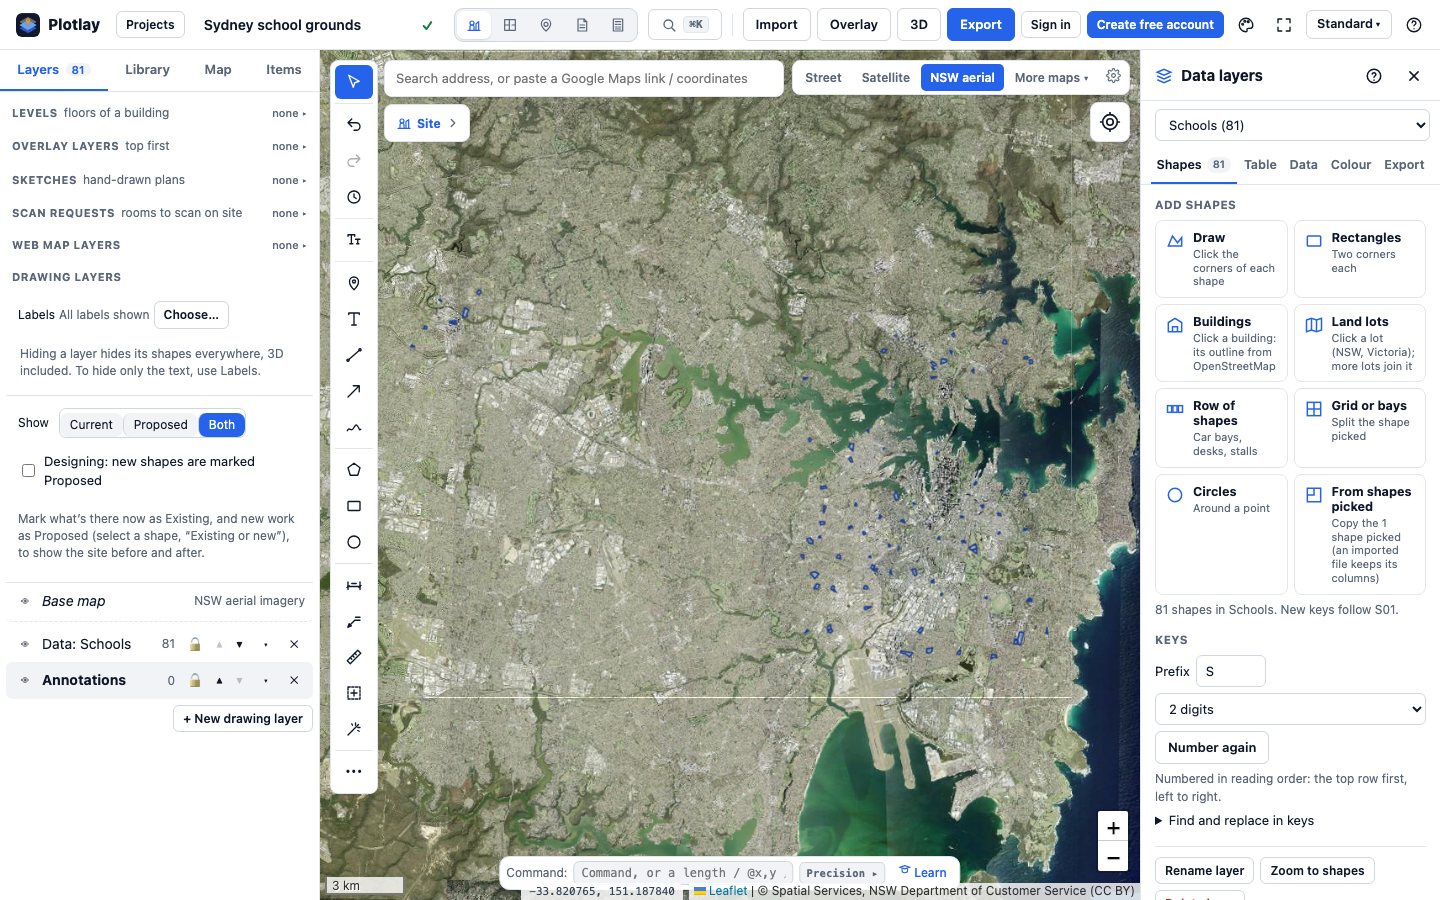
Every outline was checked against the aerial imagery: 65 fine, 6 adjusted, 10 that could not be verified (shared sites, or a school inside a bigger campus). The ones that could not be verified stay on the map but are left out of medians and rankings. Nothing here comes from OpenStreetMap.
More about Data layers · Make a data layer of your own
The other schools showcases
- NSW and SA schools side by side: the same grounds method within 7 km of the Sydney and Adelaide town halls, on 2024 students, plus spending, staffing and outcomes for each state. Its study area and year differ from this page, so its medians do too.
- Inner Sydney High, a deep dive: the vertical school left out here, measured by its estimated floor space per student instead of its land.
- One school campus, building by building: University High in Parkville drawn as its buildings and rolled up to the site, with estimated floor space.
Power BI


The same shapes and tables as a Power BI Project (.pbip): a Shape Map from the TopoJSON, Azure Maps from the GeoJSON, a year slicer, cards, a drill-through page for each school and the DAX measures, with the Plotlay theme. It reads the data straight from the GitHub repository, so it refreshes with no gateway.
The Power BI project is in the plotlay-sydney-schools repository on GitHub, with steps to open it in Power BI Desktop.
Python
A narrated Jupyter notebook loads the GeoJSON with GeoPandas, joins the tables on the school code, and recomputes every number on this page, with checks that fail if a shape changes.
Download the notebook (with its outputs) and the data. It is also in the plotlay-sydney-schools repository on GitHub.
Read it carefully
- Grounds are land, buildings included: not floor space and not playground area. Parks or sports grounds next door are not counted.
- Areas are approximate: accuracy depends on the cadastre and the imagery the outlines came from.
- Compared schools: 66 of 81. Left out of medians, counts and rankings, but on the map: 10 outlines that could not be verified, 3 schools for specific purposes and the 2 vertical schools.
- Students are the department's headcount for 2025 (not full-time equivalent). Headcount, not capacity. The open data has no capacity figures, so nothing here says a school is over capacity.
- Headcounts of 5 or fewer are published as suppressed and stay blank; none of these 81 schools is affected.
Sources and licences
School enrolment, attendance and school location data: NSW Department of Education (Centre for Education Statistics and Evaluation), data.nsw.gov.au, licensed under Creative Commons Attribution (CC BY). Changes: reshaped to one row per school per year, suppressed values left blank, contact columns removed.
Cadastre and aerial imagery: © State of New South Wales (Spatial Services, a business unit of the Department of Customer Service NSW), licensed under CC BY 3.0 AU. School outlines built from NSW Cadastre lots or traced over NSW Imagery in Plotlay.
Vertical school facts: School Infrastructure NSW, Inner Sydney High School project update, February 2020; Arthur Phillip High School project page.
Staged openings: Inner Sydney High School annual reports 2021 and 2025; Cammeraygal High School annual report 2020 and NSW Department of Education, Cammeraygal High celebrates a decade (2024); Anzac Park Public School annual reports 2016 and 2017; Bayanami Public School annual report 2019; School Infrastructure NSW, Green Square Public School welcome pack, October 2025.
Our outlines and tables are CC BY 4.0 and the code is MIT: see the licence files in the data download and the plotlay-sydney-schools repository on GitHub. Map: Leaflet. This is independent work using open data, not endorsed by the NSW Department of Education or Spatial Services.
Make shapes for your own data
Plotlay is free to start: every tool, three cloud projects.
Create free accountThen open Data layers in any map project