
Showcase · Data layers · NSW open data
Fourteen storeys on a small site
Why is Inner Sydney High the exception in a land analysis, and how much floor space does each student have? The school stands on 5,687 m² of grounds in Surry Hills: a 14-storey new building and the refurbished heritage buildings of the old Cleveland Street school. It opened in 2020 with Year 7 and added a year group each year; 2025 is its first year with Years 7 to 12. Measured by its floor space, estimated in Plotlay from each building’s footprint and storeys, it has about 24,900 m² of floor, 21.4 m² per student in 2025 (1,161 students, headcount).

Why it is the exception
The Sydney schools showcase measures the grounds each student gets: the land a school sits on, divided by its headcount. That works for schools of two or three storeys. Inner Sydney High put its classrooms on many floors of a small site instead. Its 5,687 m² of grounds come to 4.9 m² per student in 2025, where the median compared high school there has 34.7 m². The difference says how the school was built, not how much room its students have, so the land analysis leaves it out of its medians and rankings and this page measures it by floor space.
The map
Step the slider from 2007. Before 2020 the site is the old Cleveland Street school; from 2018 the new building is going up; from 2020 the readout gives the year’s headcount, the floor in use and the floor space per student. The picture in the corner is the real one nearest to the year, with its own date. Hover over a building, or tap it, for its numbers.
Floor space, estimated
Each building is a shape in Plotlay with its storeys, and a formula column multiplies its footprint by them. The new building is two shapes: the podium, the whole new building at ground level (2,102 m², from OpenStreetMap), for its 6 storeys from the basement to Level 3, and the tower, its roof outline drawn over the NSW aerial photo (994 m²), for its 8 storeys from Level 4 to Level 11. That makes 14, as School Infrastructure NSW counts them. The heritage buildings take their 2 or 3 storeys from OpenStreetMap. Rolled up to the site: about 24,900 m², 20,561 m² of it in the new building.
The approved plans count floor differently. Their gross floor area leaves out stairs, lifts, plant rooms and walls and counts covered outdoor terraces in a line of their own: 18,154 m² in all, 12,616 m² of it enclosed (SSD 7610). Per student in 2025 that is 15.6 m², or 10.9 m² enclosed. The estimate is 1.37 times the approved total because it counts every storey over each footprint, the open undercroft and the terraces included. Both are floor space; they answer slightly different questions.


A year group at a time
The headcount went 147, 358, 591, 797, 999 and 1,161 from 2020 to 2025: a planned, staged opening. In 2020 Year 7 used only the refurbished heritage buildings (4,331 m², estimated); the new building opened for Term 1 2021. So the floor per student jumped to 69.5 m² in 2021, when two year groups had the whole school, and has fallen each year since, to 21.4 m² in 2025. At the 1,200 students it was built for it would be about 20.7 m².

The site through time
The real pictures of the site that can be republished, oldest first. None openly licensed was found for the build itself (2017 to 2019) or for 2022 to 2025; the map’s inset shows the nearest one with its real date. The NSW historical aerial photos of 2004 and 2005 are left out because their licence is not stated.
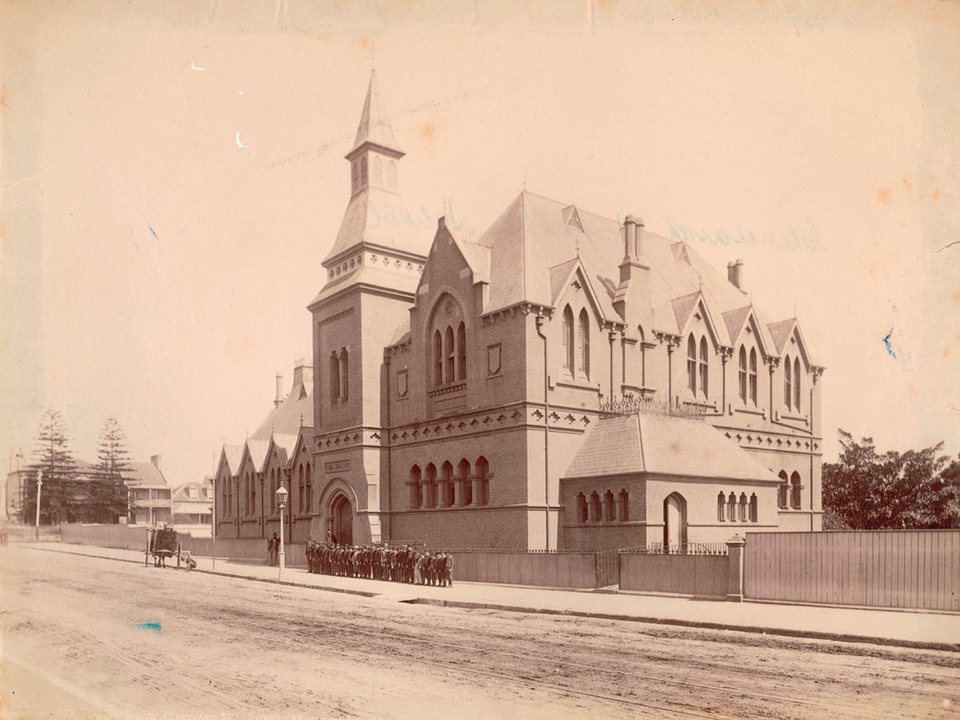 c. 1880 to 1890Cleveland Street Public School from the street. Photo: Henry King, State Library of NSW, CC0 1.0
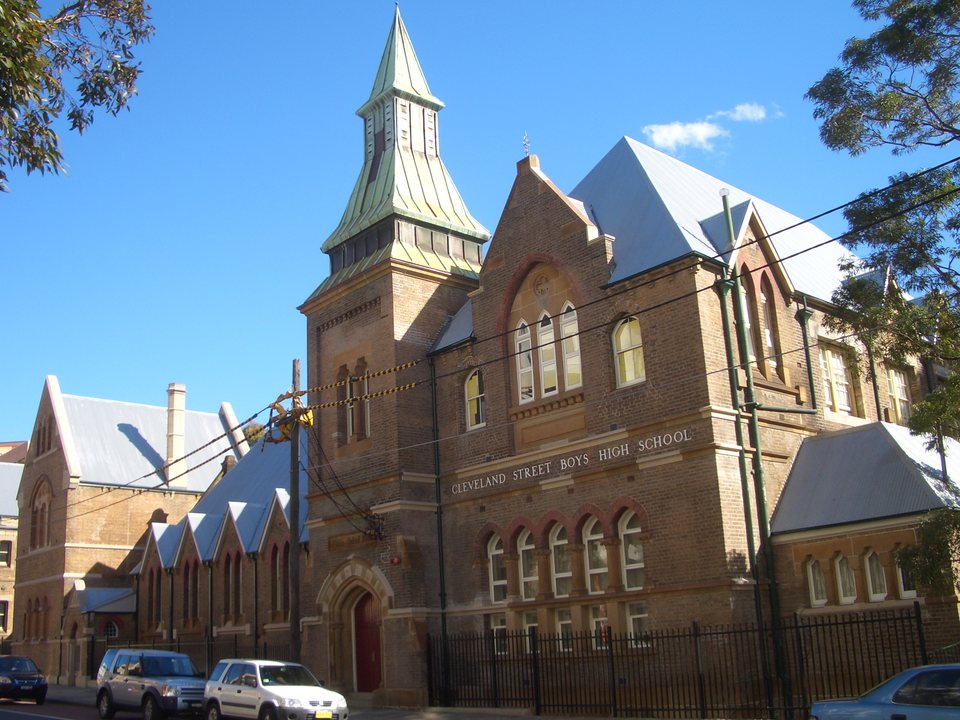 28 July 2007Cleveland Street High School, before the new school. Photo: J Bar, CC BY 2.5
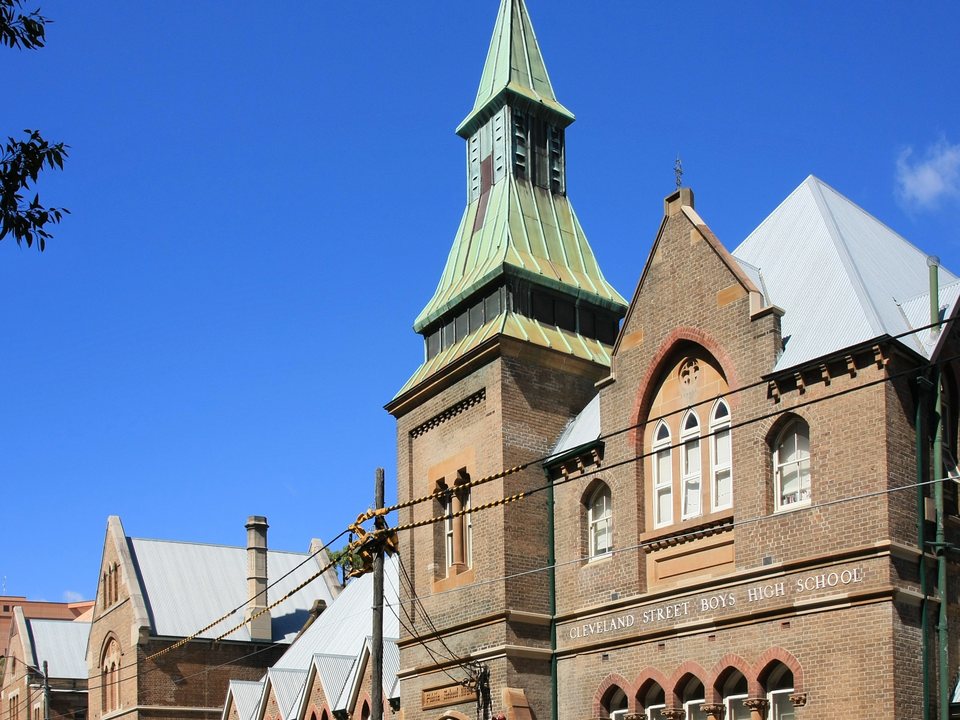 December 2009The heritage buildings from Cleveland Street. Photo: Adam.J.W.C., CC BY-SA 2.5
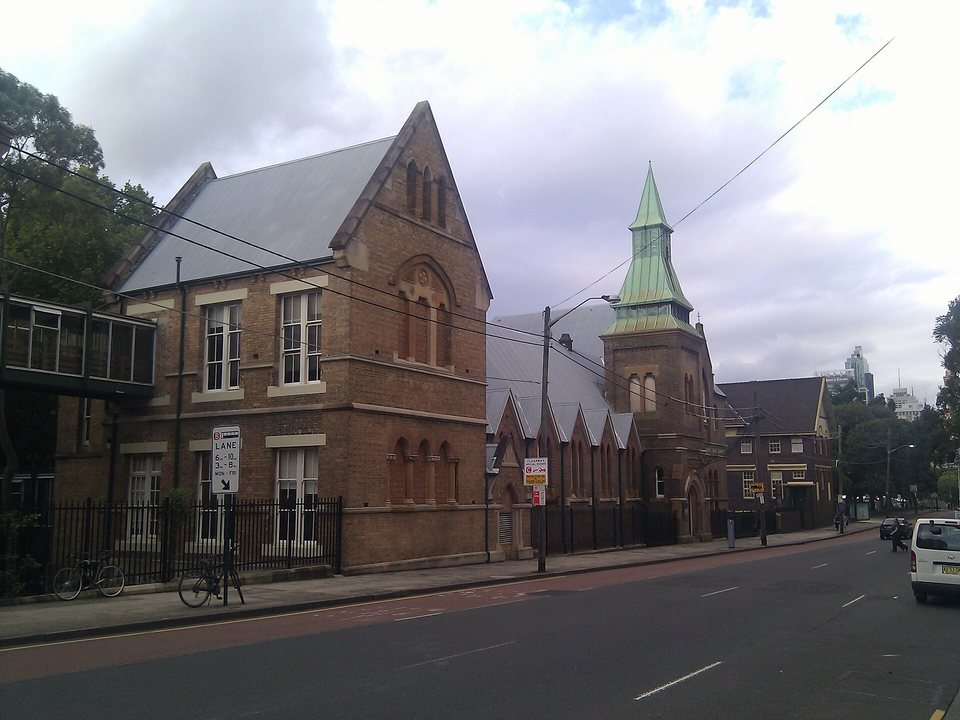 7 February 2012The heritage buildings from the Cleveland and Chalmers corner. Photo: Maksym Kozlenko, CC BY-SA 3.0
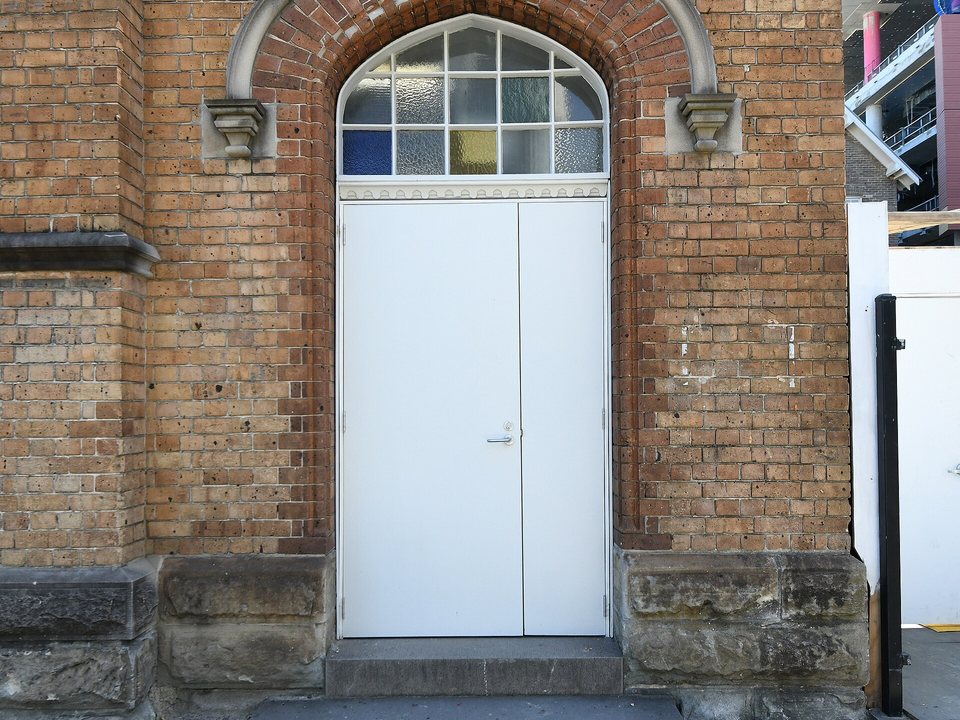 25 February 2020A refurbished heritage doorway, the month Year 7 started; building works at the right edge. Photo: Sardaka, CC BY-SA 4.0
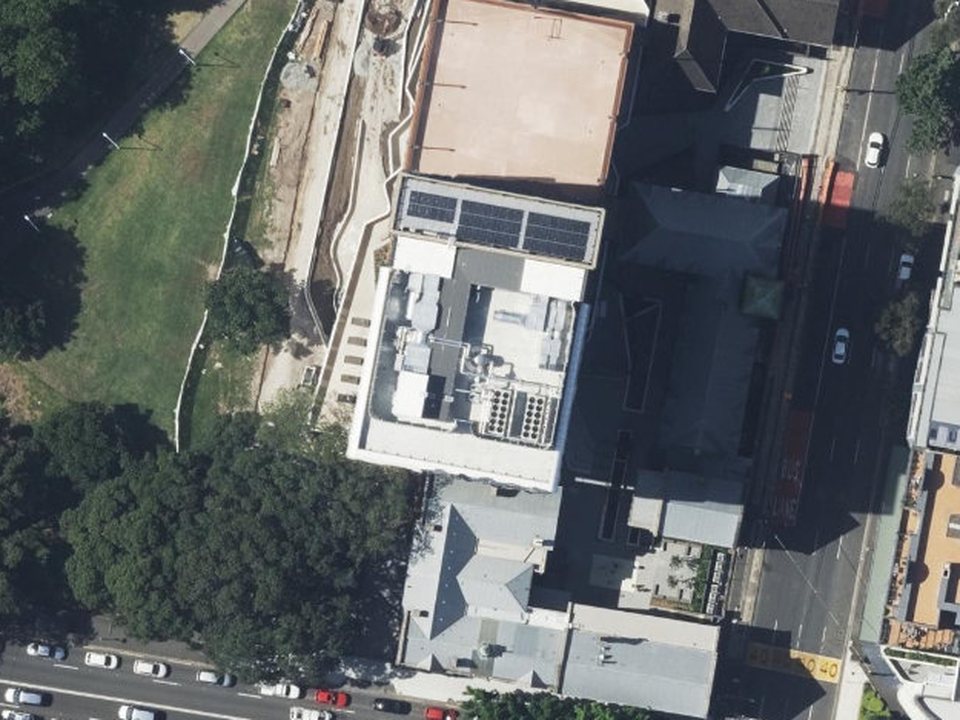 22 January 2021From above: the tower finished, the park side still being landscaped. NSW Imagery, © Spatial Services, extracted 8 November 2026, CC BY 3.0 AU


How it was made in Plotlay
- A map project on the NSW aerial imagery, and two data layers: School site and Buildings (Data layers, in the Site workspace).
- Pick the lots. Land lots: a click on each of the school’s three NSW Cadastre lots joins them into one shape, keyed by the school code 8913.
- Link the tables to the site: the department’s headcount for 2020 to 2025 and the floor in use each year.
- The buildings. The tower’s roof outline drawn over the aerial photo; the podium and the heritage buildings picked from an OpenStreetMap layer with its licence (Pick from a layer). Keyed P, T and H1 to H4, with the buildings table linked: storeys, heights and the year each came into use.
- A formula column: floor space, estimated, is
round(area_m2 * storeys). - 3D: each building at its height in floor plates, the tower standing on the podium’s roof (a base height for the shape).
- Roll up the buildings to the site: how many, their footprint, their floor space.
- Colour the site by m² of floor (estimated) per student: the floor in use each year over that year’s headcount, on the time slider from 2020 to 2025.
- Export GeoJSON, TopoJSON for the Power BI Shape Map, CSV with WKT, the linked data and a Python starter.


More about Data layers · Make a data layer of your own
Power BI


The same shapes and tables as a Power BI Project (.pbip): a Shape Map of the buildings from the TopoJSON keyed P, T and H1 to H4, a year slicer, measures for the floor in use and the floor per student, and the approved floor areas for the check, with the Plotlay theme. It reads the data from the GitHub repository, so it refreshes with no gateway.
The Power BI project is in the plotlay-inner-sydney-high repository on GitHub, with the steps to open it in Power BI Desktop.
Python
A narrated Jupyter notebook loads the shapes with GeoPandas, recomputes every building’s floor estimate, the floor in use each year and the floor per student, and checks them against the approved floor areas.
Download the notebook (with its outputs) and the data. Both are also in the plotlay-inner-sydney-high repository on GitHub.
Read it carefully
- Floor space is an estimate: each building’s footprint times its storeys. It counts covered terraces, the open undercroft, stairs, lifts, plant and walls, so it is larger than the approved gross floor area. Treat it as a scale, not a measured floor area.
- The tower’s outline was drawn over an aerial photo of a tall building, which shows the roof a little displaced from the base, so its 994 m² is approximate. Every 100 m² of tower footprint changes the estimate by 800 m², about 0.7 m² per student in 2025.
- Storeys: School Infrastructure NSW says 14; the development consent says 13 plus a basement and the rooftop court; OpenStreetMap tags 14 above ground and 2 below. The estimate uses 14 (Basement to Level 11) as SINSW’s January 2021 welcome pack lists the levels.
- Heights in 3D: the new building from the approved design levels above Cleveland Street, the heritage buildings estimated at 4 m a storey. No LiDAR height was used: the open NSW elevation services give ground only, and the LiDAR itself is supplied by order.
- Students are the department’s headcount, not full-time equivalent, and not capacity.
- Areas are approximate: accuracy depends on the cadastre, the OpenStreetMap outlines and the aerial photo the shapes came from.
- Floor space here is a measure of this school only. Many schools have buildings of several storeys, so it is not ranked against any other school.
The other schools showcases
- Sydney schools: grounds per student across 81 inner Sydney and Parramatta government schools (2025 headcount), where Inner Sydney High is the vertical-school exception.
- NSW and SA schools side by side: the same grounds method within 7 km of the Sydney and Adelaide town halls (2024 students), plus spending, staffing and outcomes.
- One school campus, building by building: University High in Parkville drawn as its buildings and rolled up to the site, with estimated floor space from the council’s heights.
Sources and licences
Headcounts: NSW Department of Education (Centre for Education Statistics and Evaluation), data.nsw.gov.au, licensed under Creative Commons Attribution (CC BY).
Cadastre and aerial imagery: © State of New South Wales (Spatial Services, a business unit of the Department of Customer Service NSW), licensed under CC BY 3.0 AU; NSW Imagery of 22 January 2021 at the school (NSW Imagery Dates), extracted 8 November 2026. The site built from NSW Cadastre lots and the tower drawn over NSW Imagery in Plotlay.
Podium and heritage building outlines and their storeys: © OpenStreetMap contributors, available under the Open Database Licence (ODbL) 1.0. The buildings layer made from them is shared under the same licence.
Storeys, the staged opening and the new building’s first term: School Infrastructure NSW, Inner Sydney High School project page, information boards (December 2020) and welcome pack (January 2021), © State of New South Wales (Department of Education), CC BY 4.0.
Approved floor areas, design levels and capacity, quoted with their source: NSW Planning Portal, State Significant Development SSD 7610, Inner Sydney High School: approved plans (28 February 2018, GFA area schedule rev C and Section A rev D), environmental assessment report and development consent. The documents are not republished.
Pictures: each with its own credit and licence above (Wikimedia Commons, CC0, CC BY 2.5, CC BY-SA 2.5, CC BY-SA 3.0, CC BY-SA 4.0; NSW Imagery, CC BY 3.0 AU). The share-alike pictures stay under their licences.
Our tables are CC BY 4.0 and the code is MIT. Map: Leaflet. This is independent work using open data, not endorsed by the NSW Department of Education, School Infrastructure NSW, Spatial Services or the school.
Map your own buildings
Plotlay is free to start: every tool, three cloud projects.
Create free accountThen open Data layers in any map project