
Showcase · Data layers · NSW and SA open data
Government schools, NSW and SA
Do inner Sydney and inner Adelaide schools get the same grounds per student, measured the same way, and how do the two systems compare on spending, staffing and outcomes?
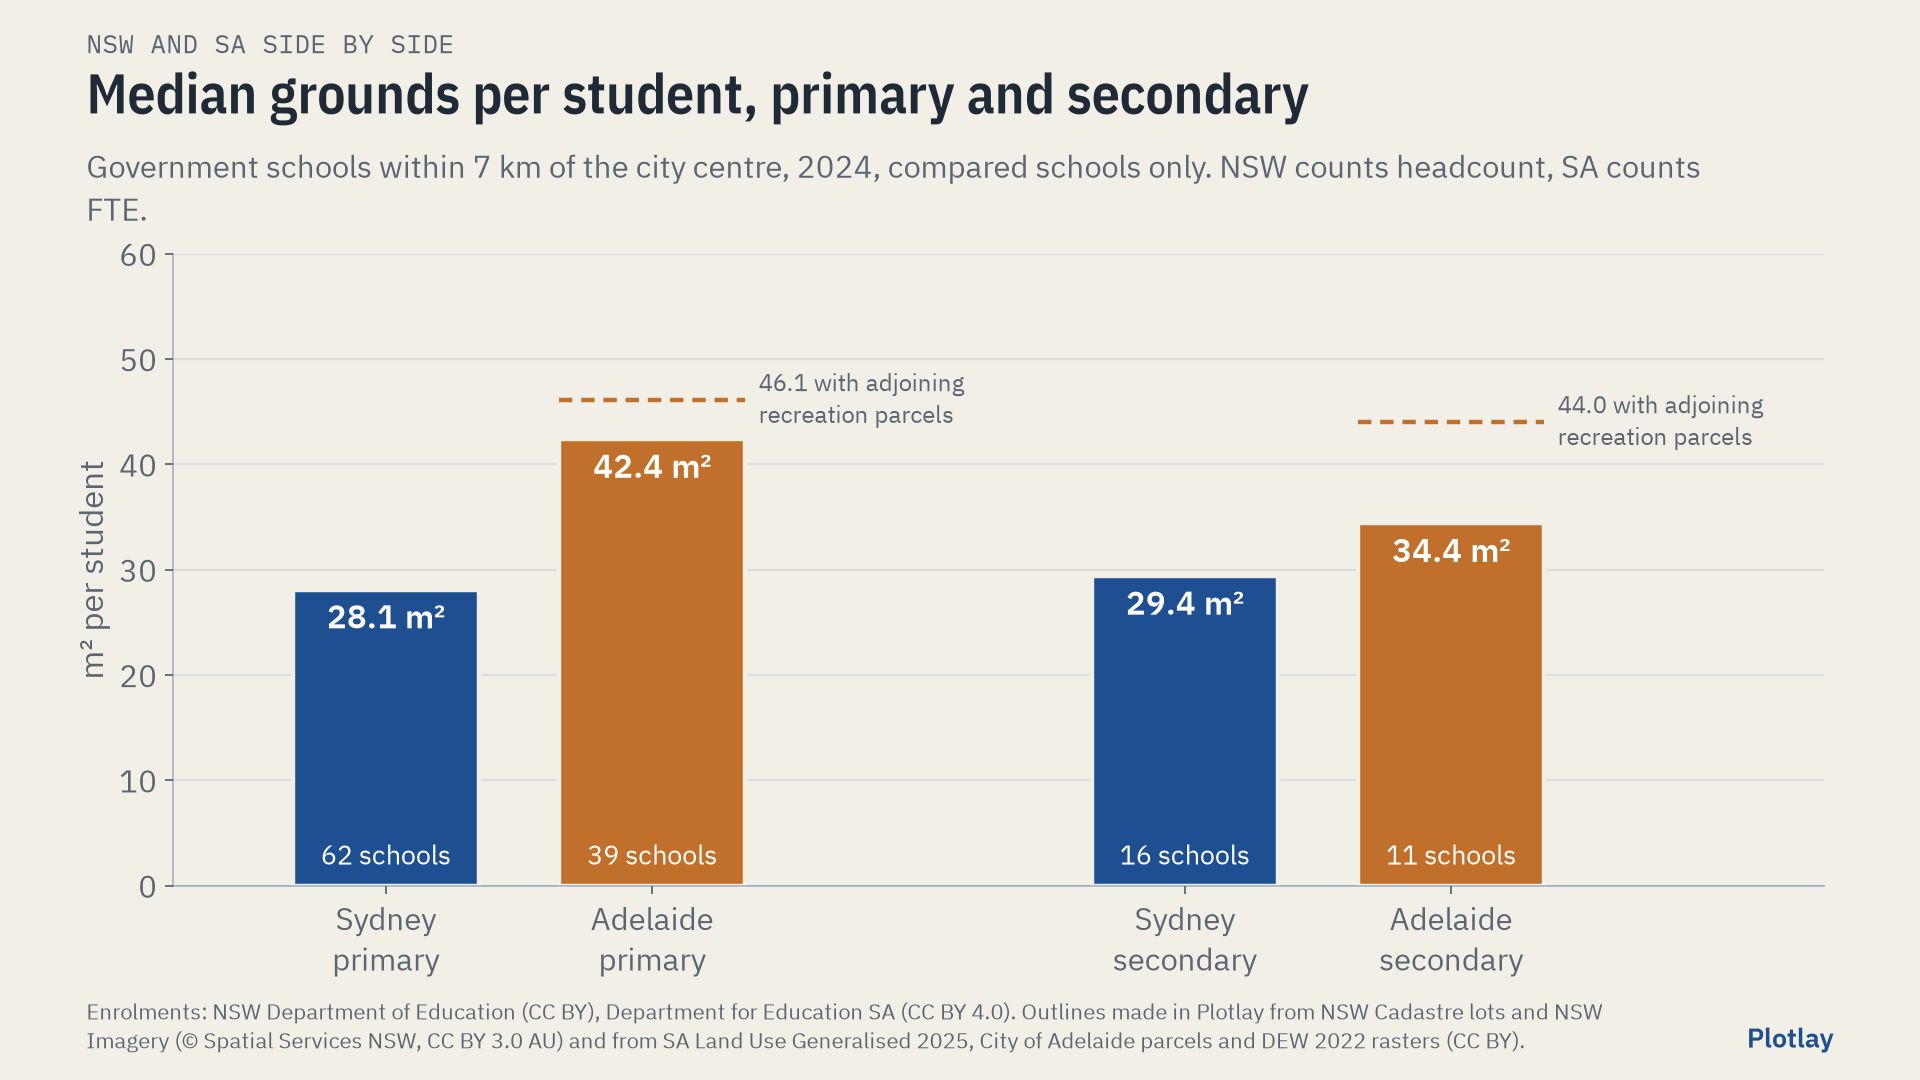
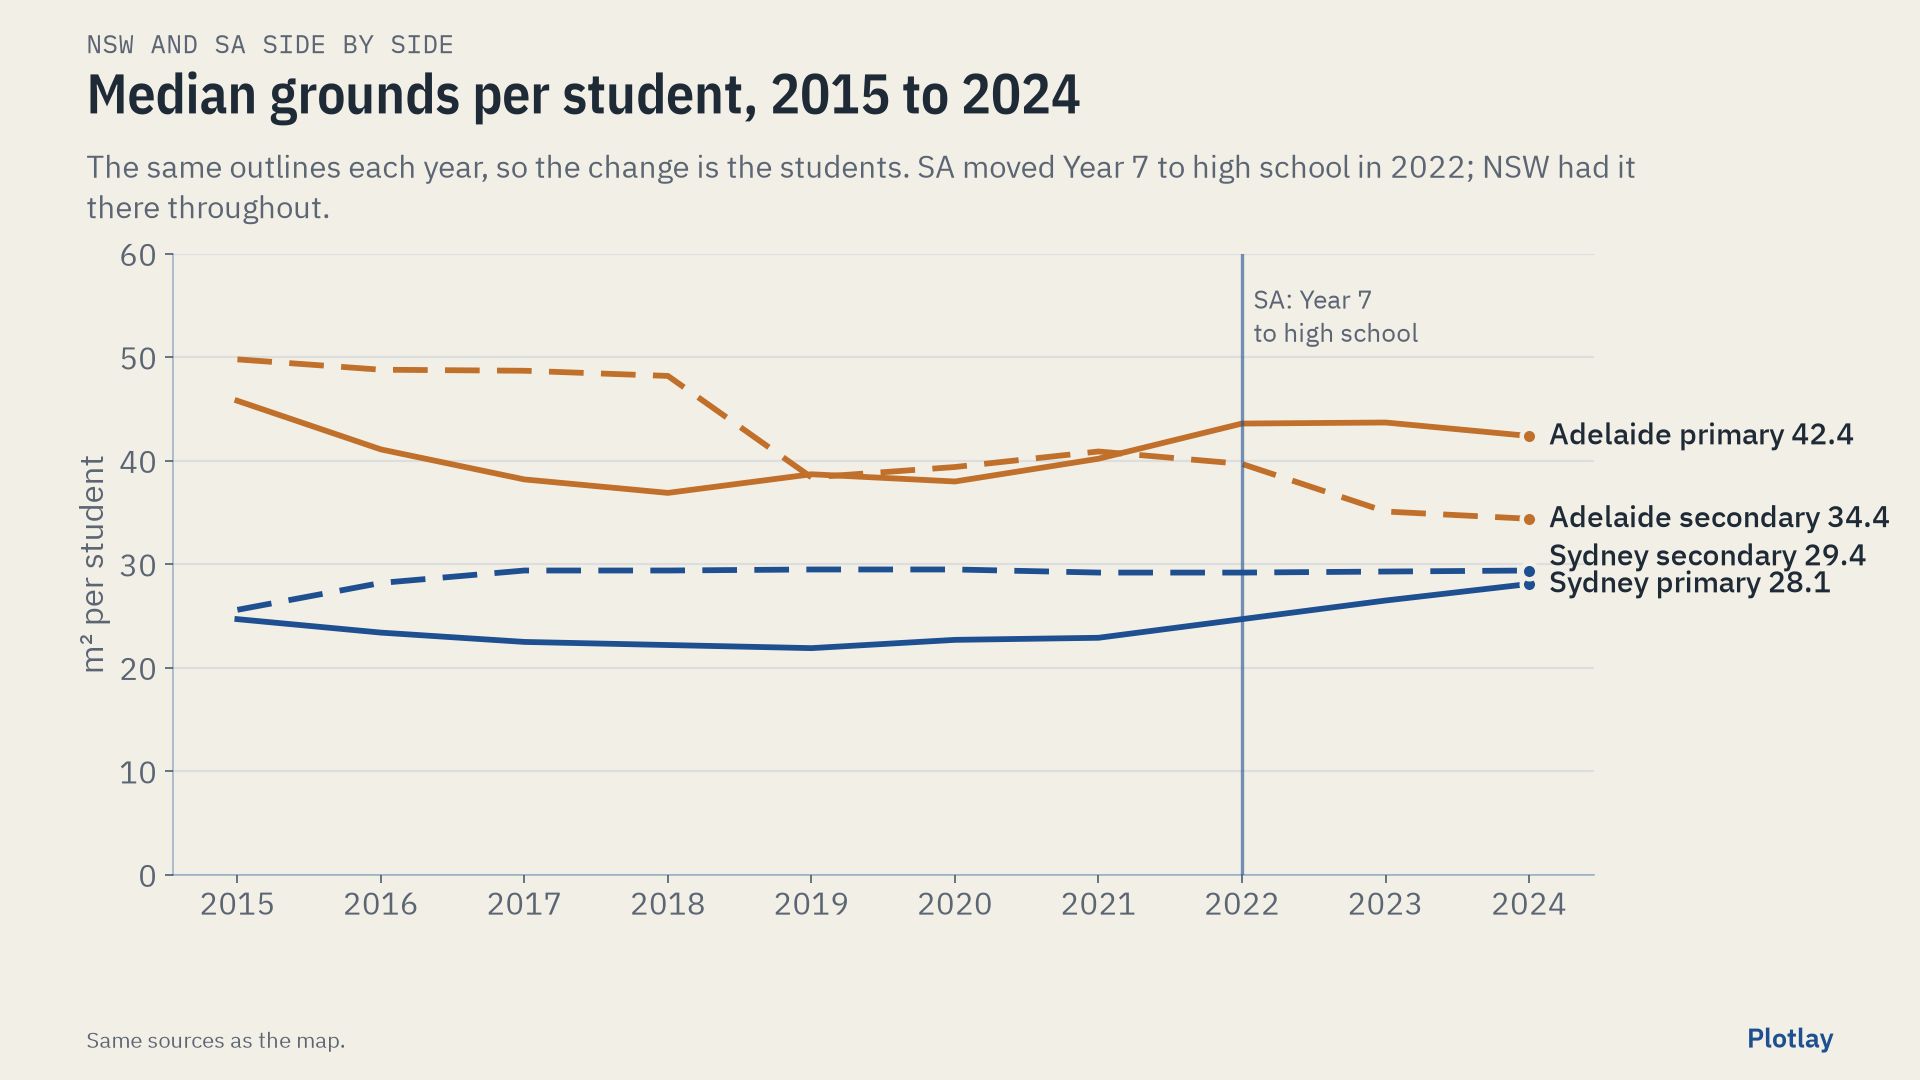
The same analysis done twice, then side by side: spending, staffing, outcomes and the grounds each school sits on, for New South Wales and for South Australia. Within 7 km of the city centre, inner Sydney’s government schools have a median of 28.1 m² of grounds per primary student; inner Adelaide’s, on the same rules, 42.4 m².
Neither state publishes how much land its schools sit on. The outlines were made in Plotlay: in Sydney from NSW Cadastre lots, and in Adelaide, where there is no open cadastre and no open aerial imagery, from the state’s open land use file. This page shows differences side by side. It does not say which state is better, and it claims no cause and effect.
View 1 of 3
NSW on its own
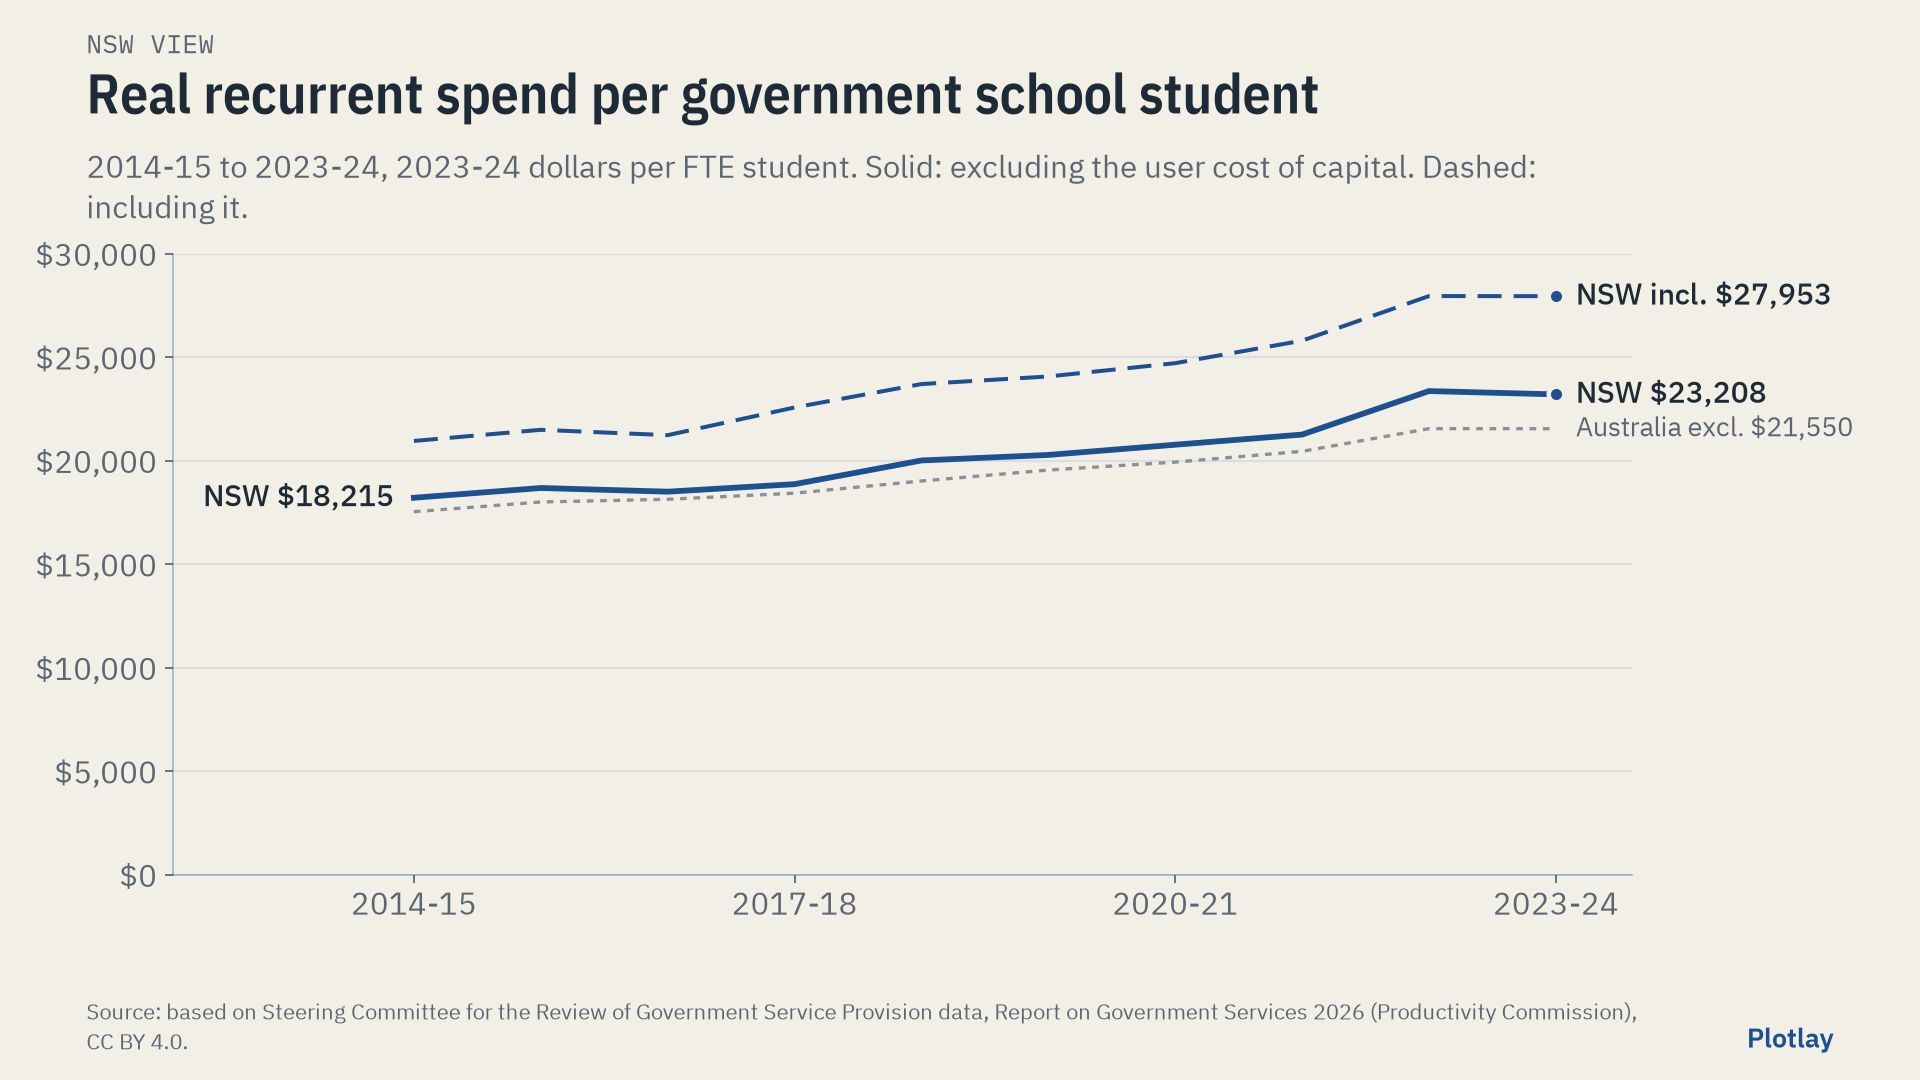
Government schools in NSW. Spending, staffing, attendance and retention are for NSW’s government schools (Report on Government Services 2026); NAPLAN is all sectors (ACARA); grounds per student are for the 86 mainstream government schools within 7 km of Sydney Town Hall, with outlines from NSW Cadastre lots, clicked in Plotlay on the NSW aerial imagery.
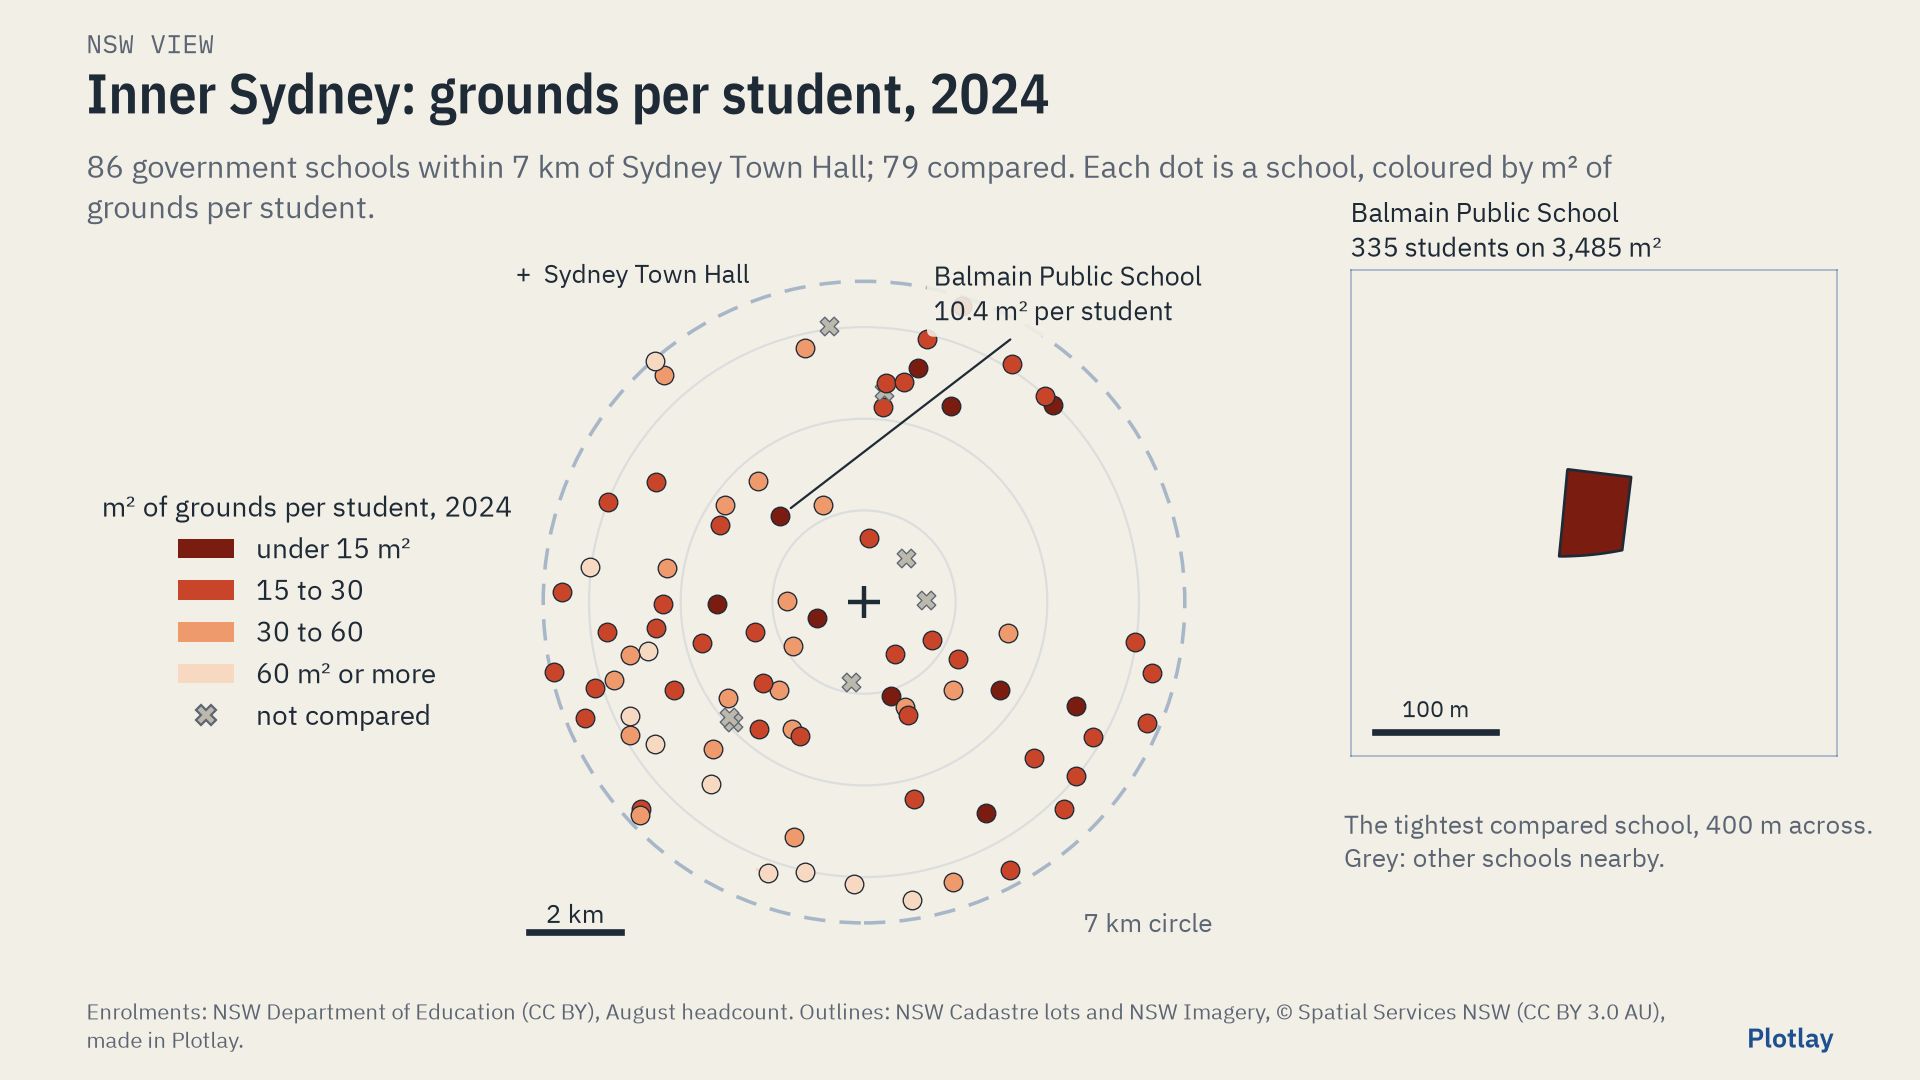
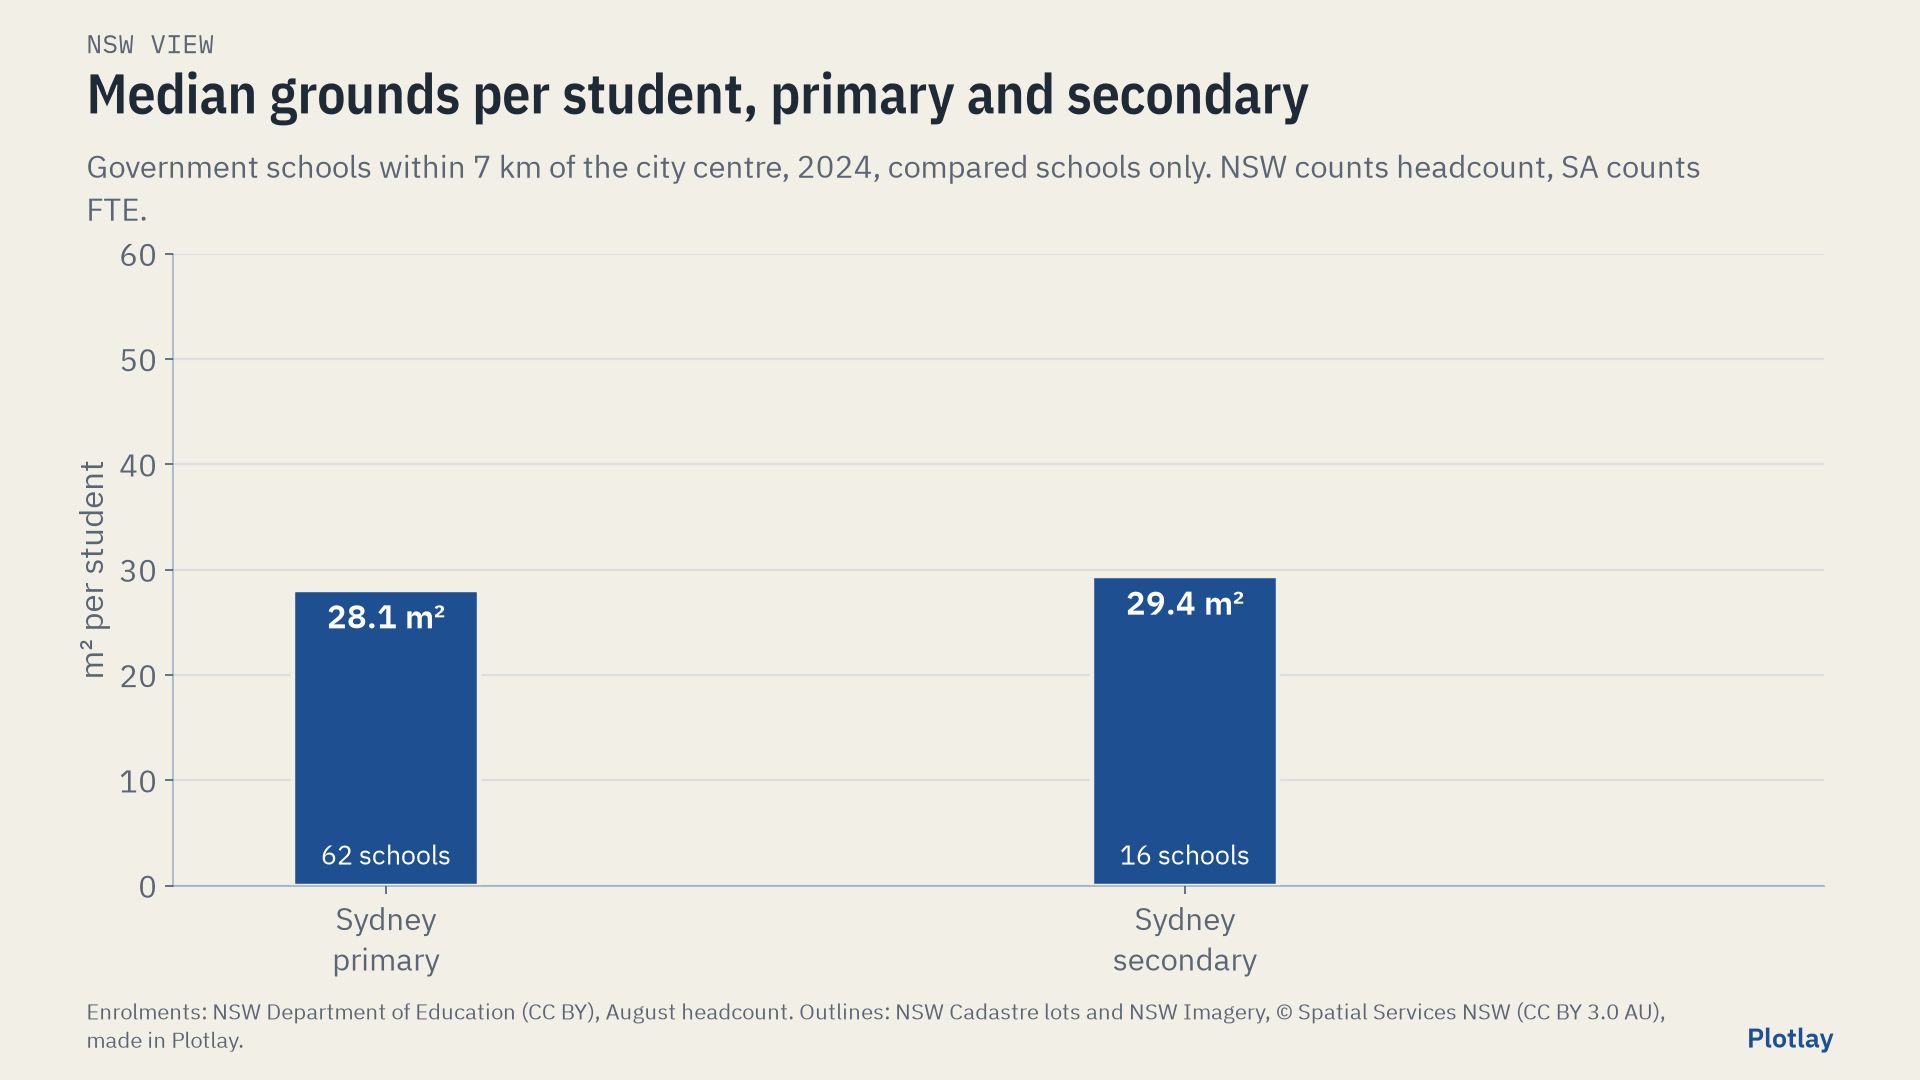
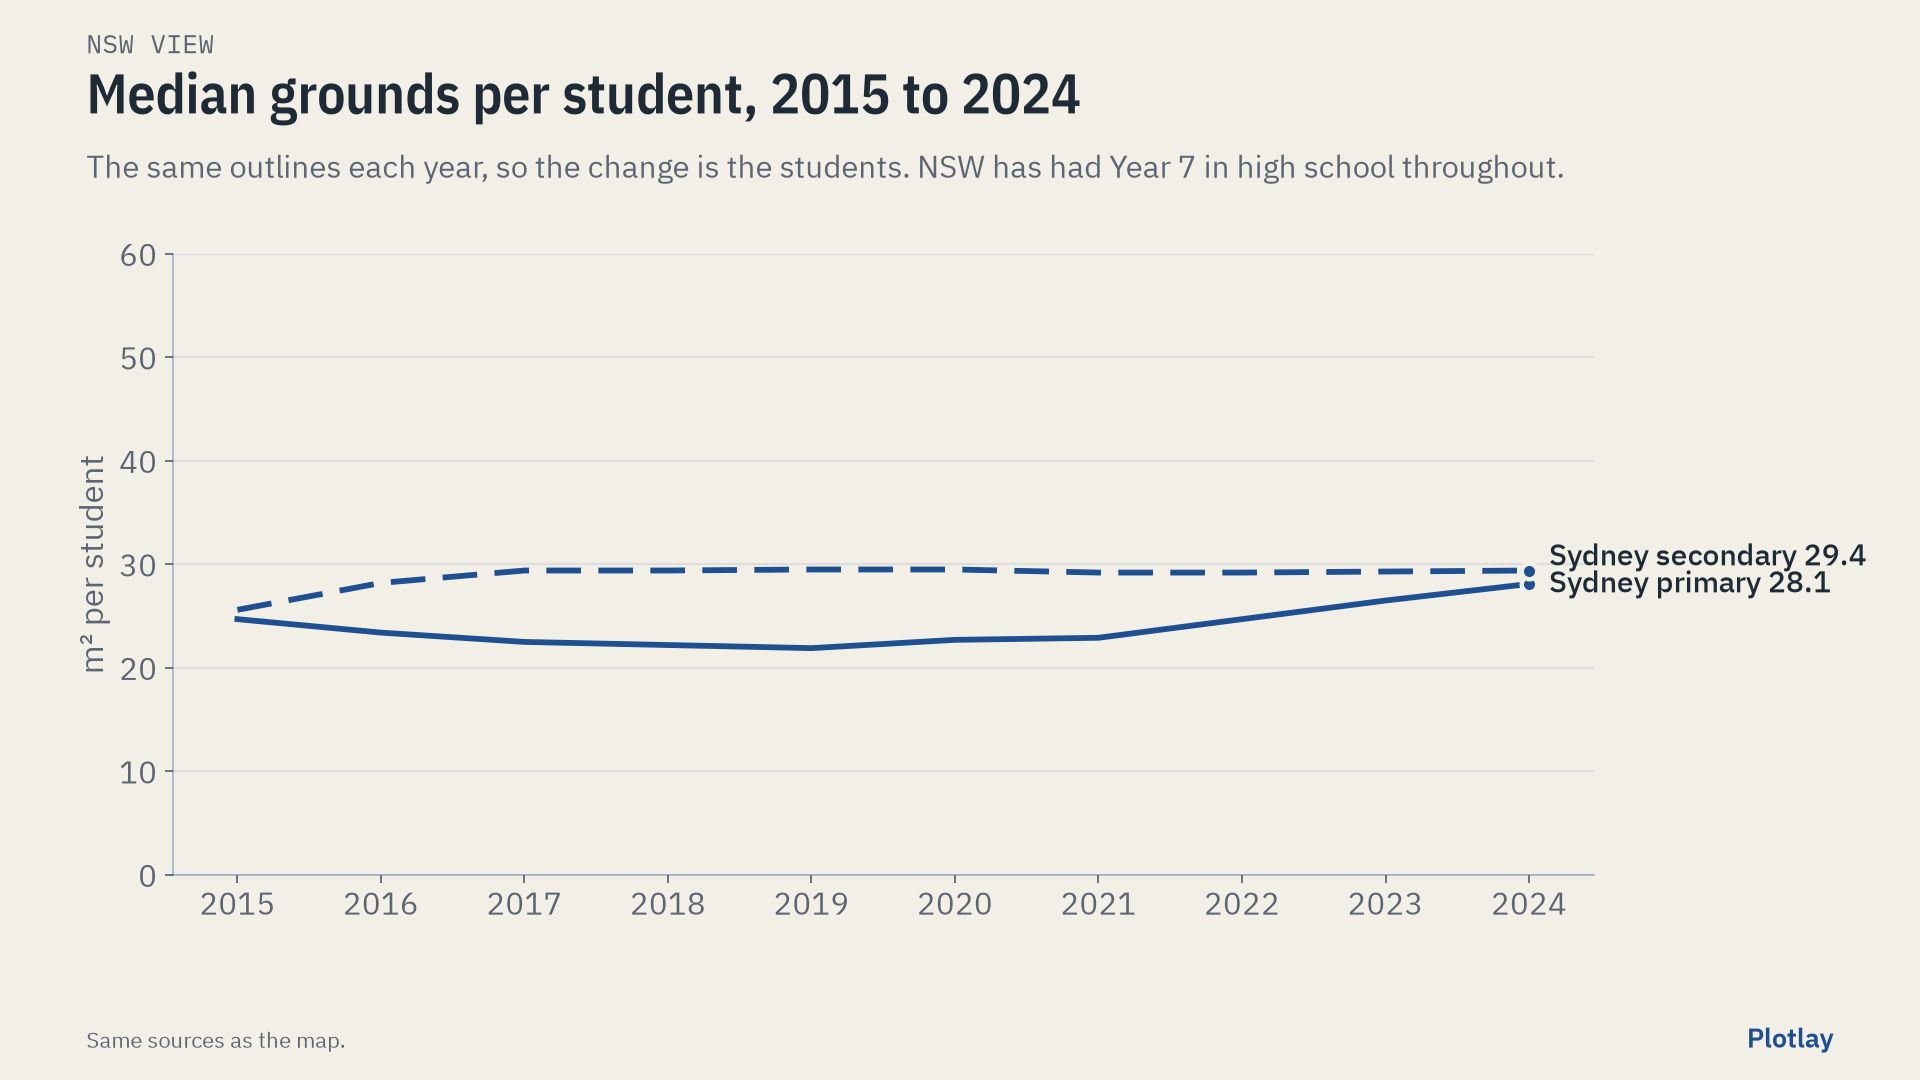
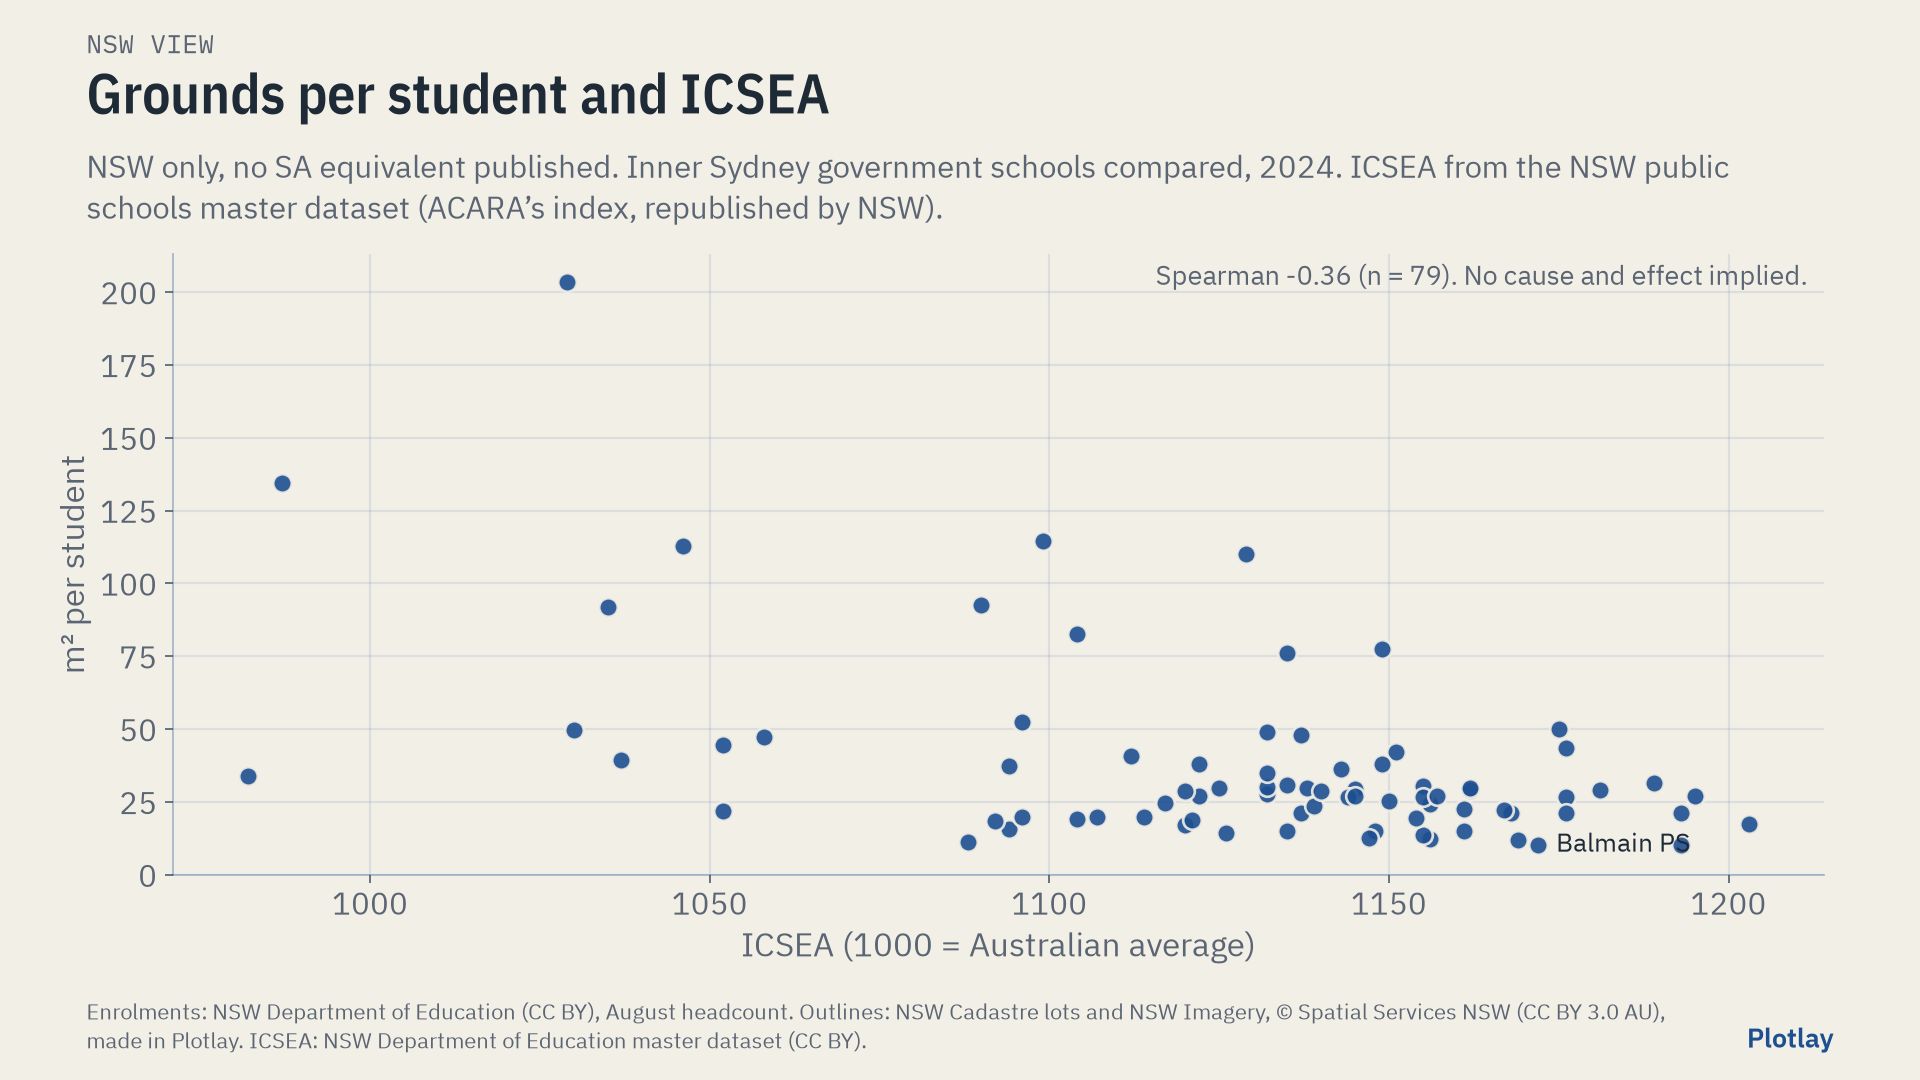
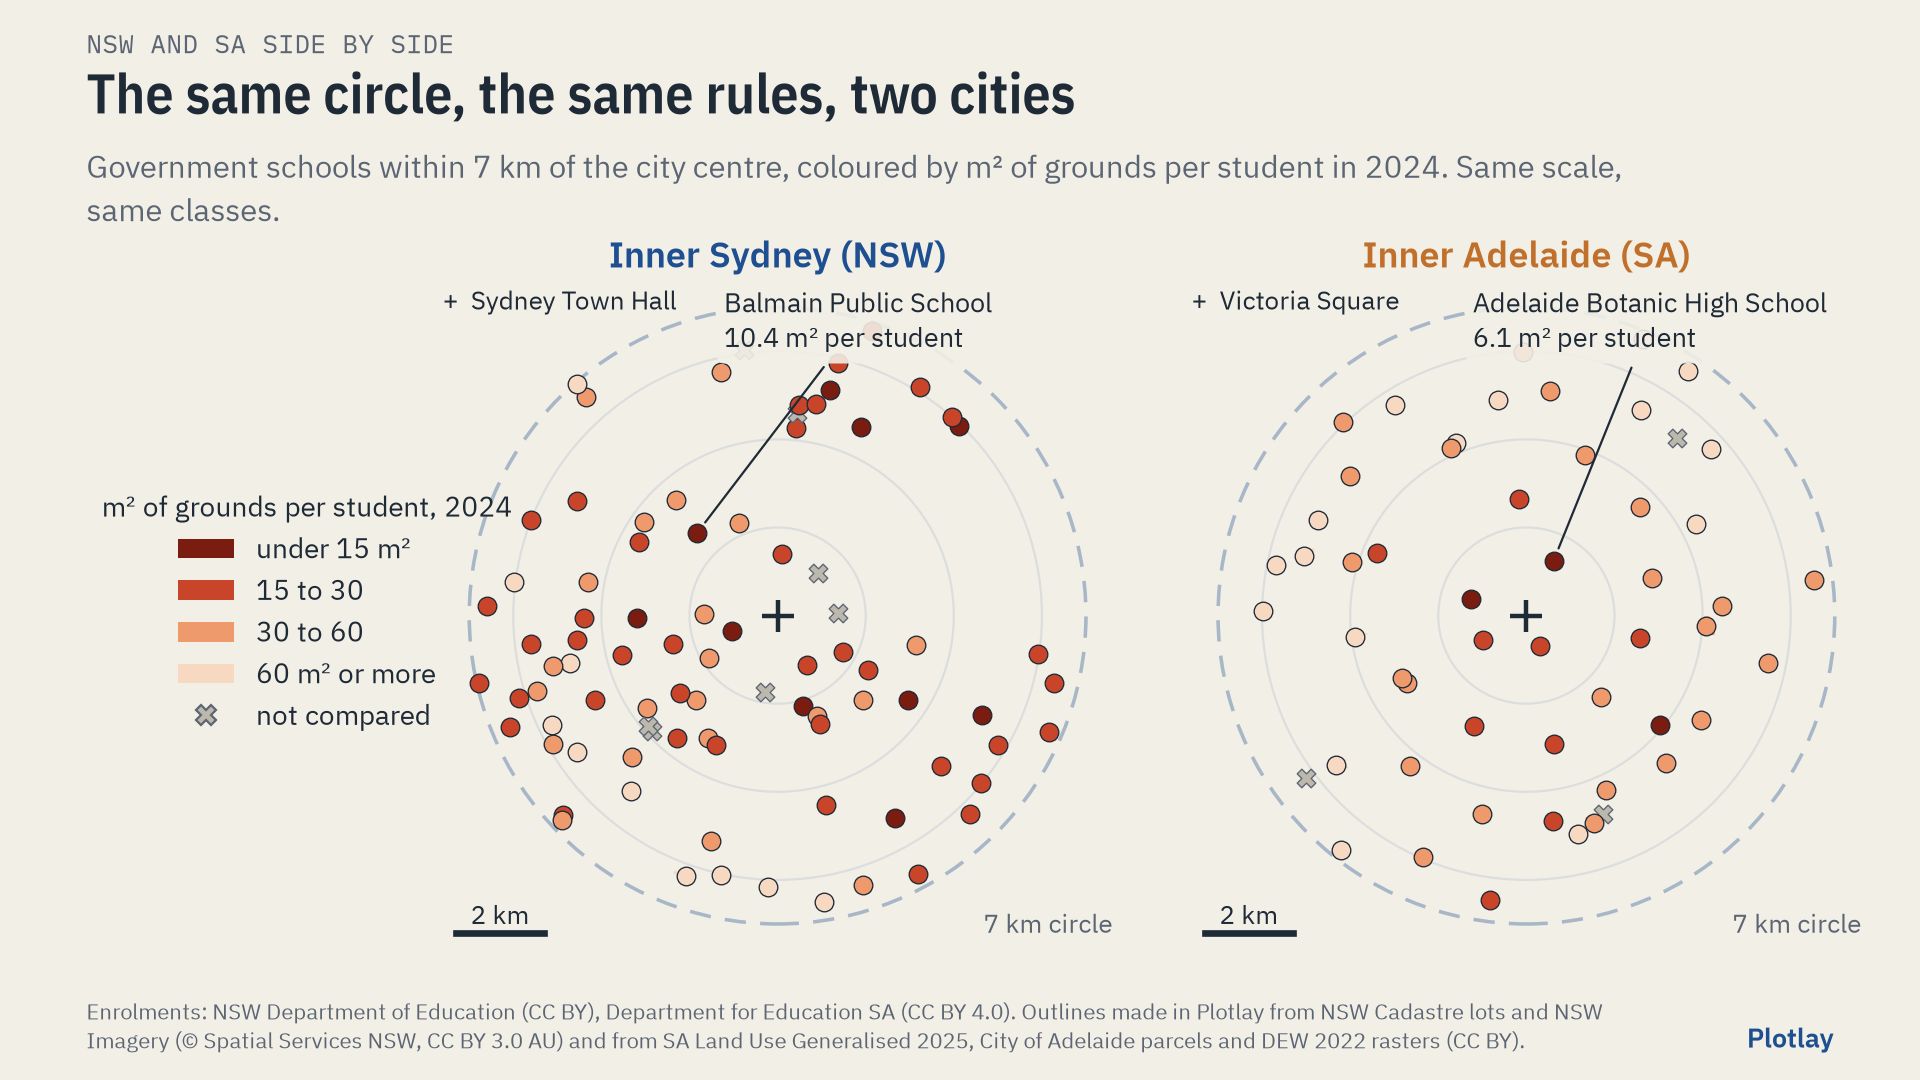
The tightest compared school is Balmain Public School: 335 students on 3,485 m², 10.4 m² each. 10 compared schools have under 15 m² per student. Medians: primary 28.1 m² (62 schools), secondary 29.4 m² (16).
Inner Sydney High School opened in 2020 with Year 7 and added a year group each year; 2025 is its first year with Years 7 to 12. In 2024 it did not yet have all its year groups, so it is shown but left out of the medians, by the same rule in both cities. In 2025 it had 1,161 students (August headcount) on 5,687 m² of grounds: 4.9 m² each. It is also a 14-storey vertical school, so its grounds per student are not a fair comparison with low-rise schools in any year. Inner Sydney High, a deep dive measures it by its estimated floor space per student instead.
This page uses the 86 government schools within 7 km of Sydney Town Hall and 2024 students (NSW August headcount, SA Term 3 FTE). The Sydney schools showcase uses 81 schools across inner Sydney and Parramatta and 2025 headcount, so its medians differ.
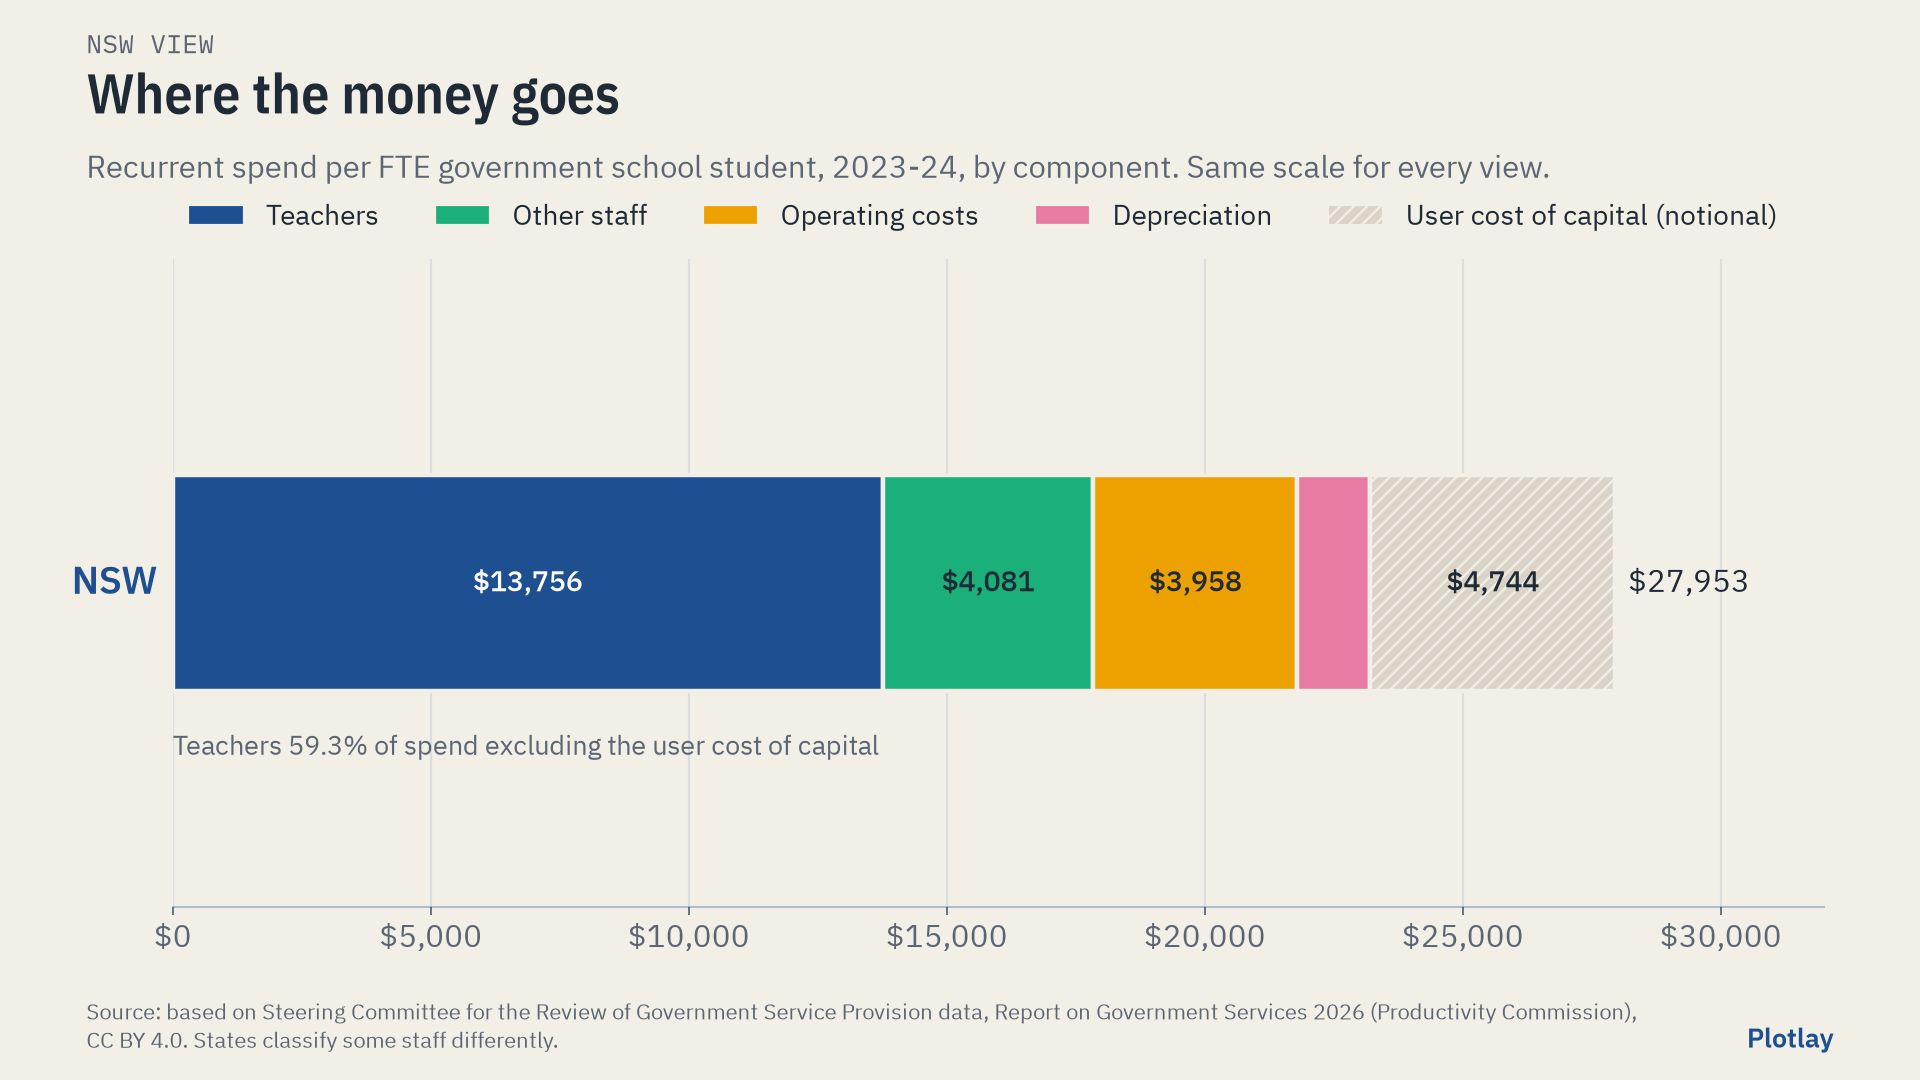
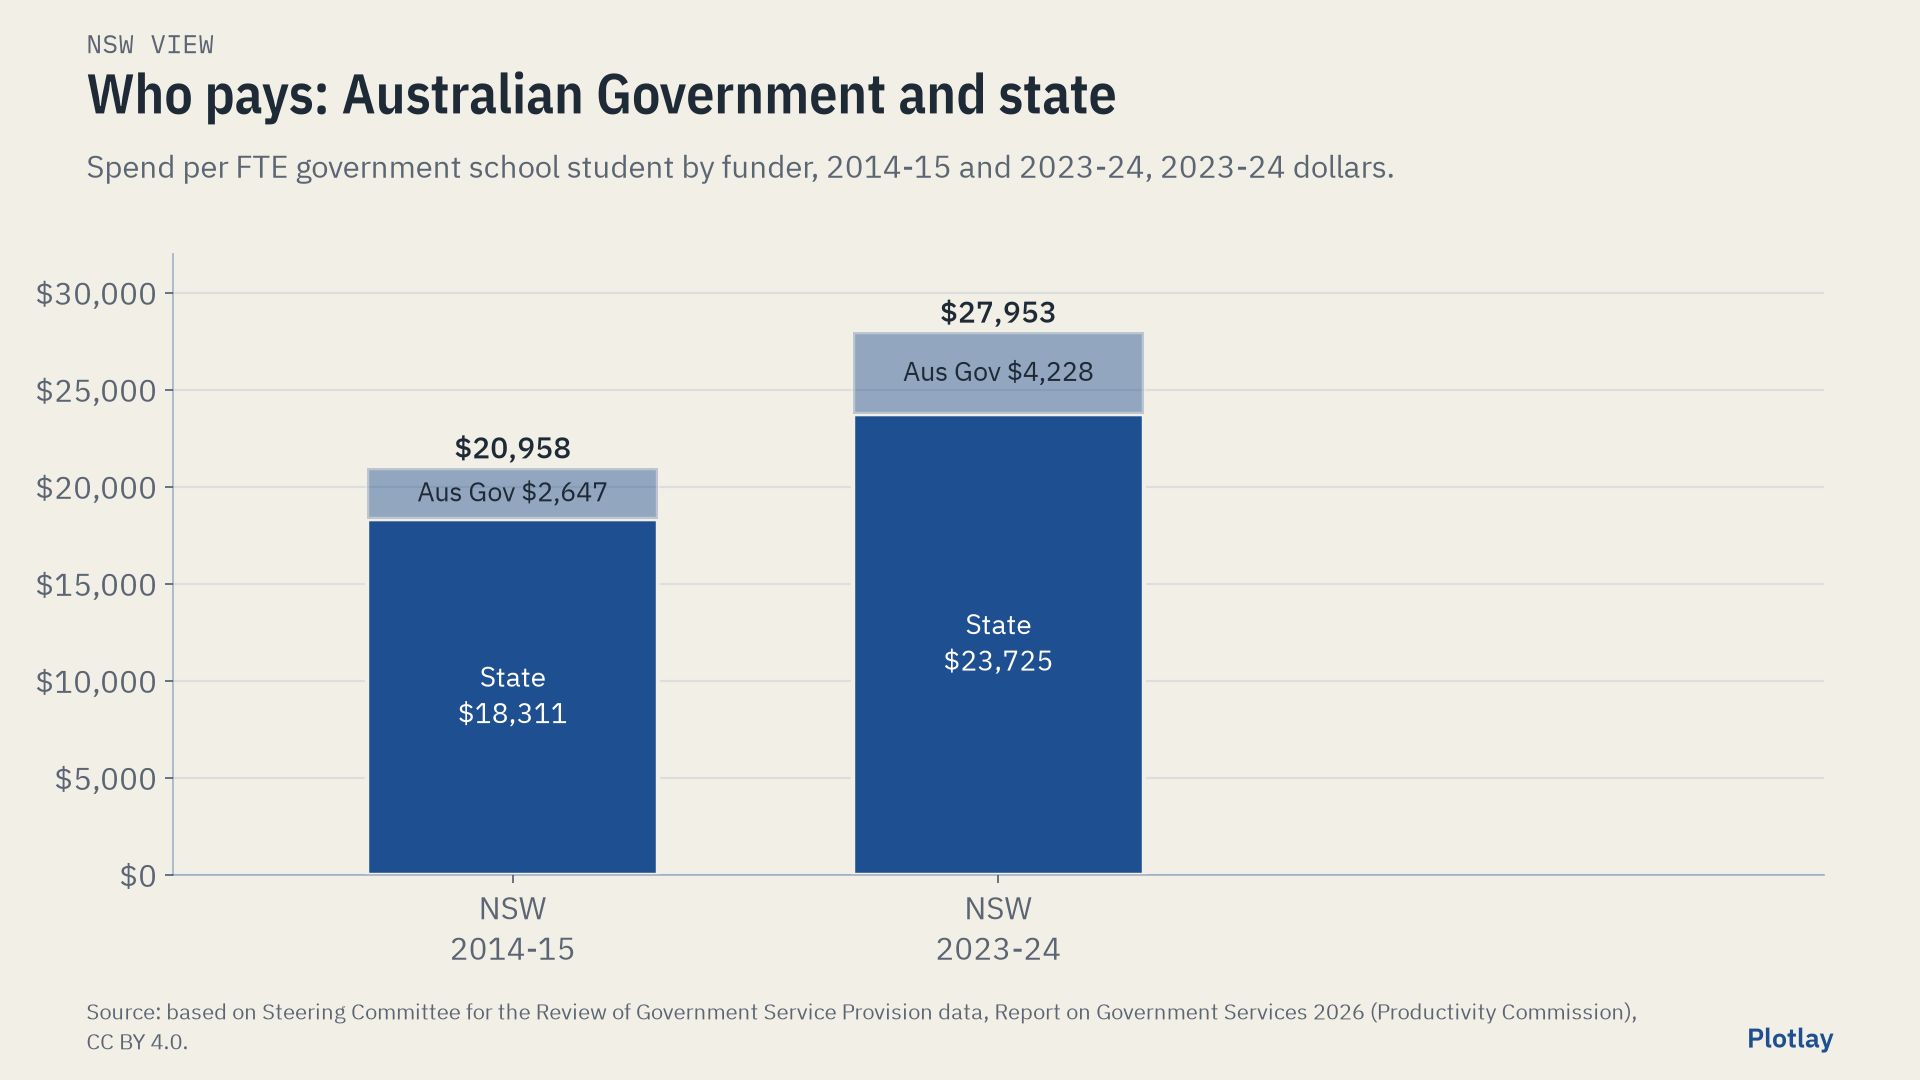
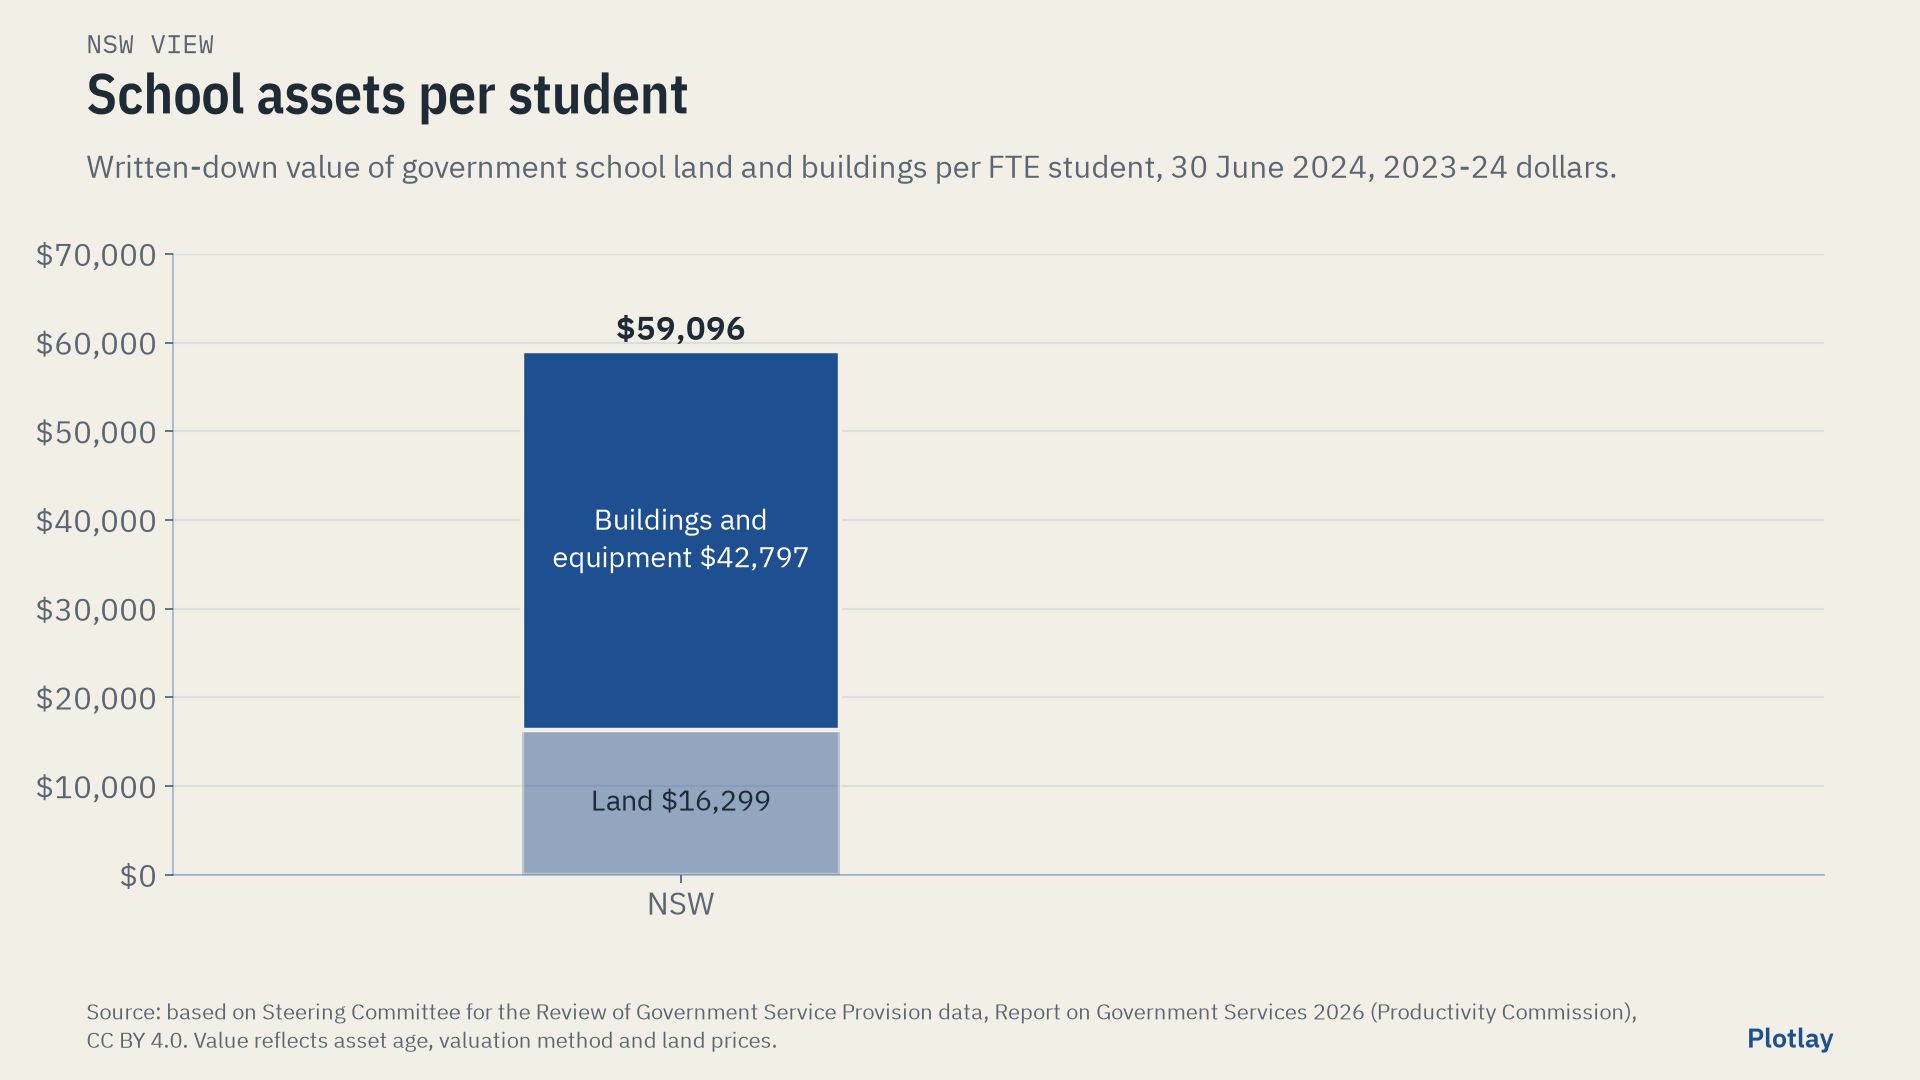
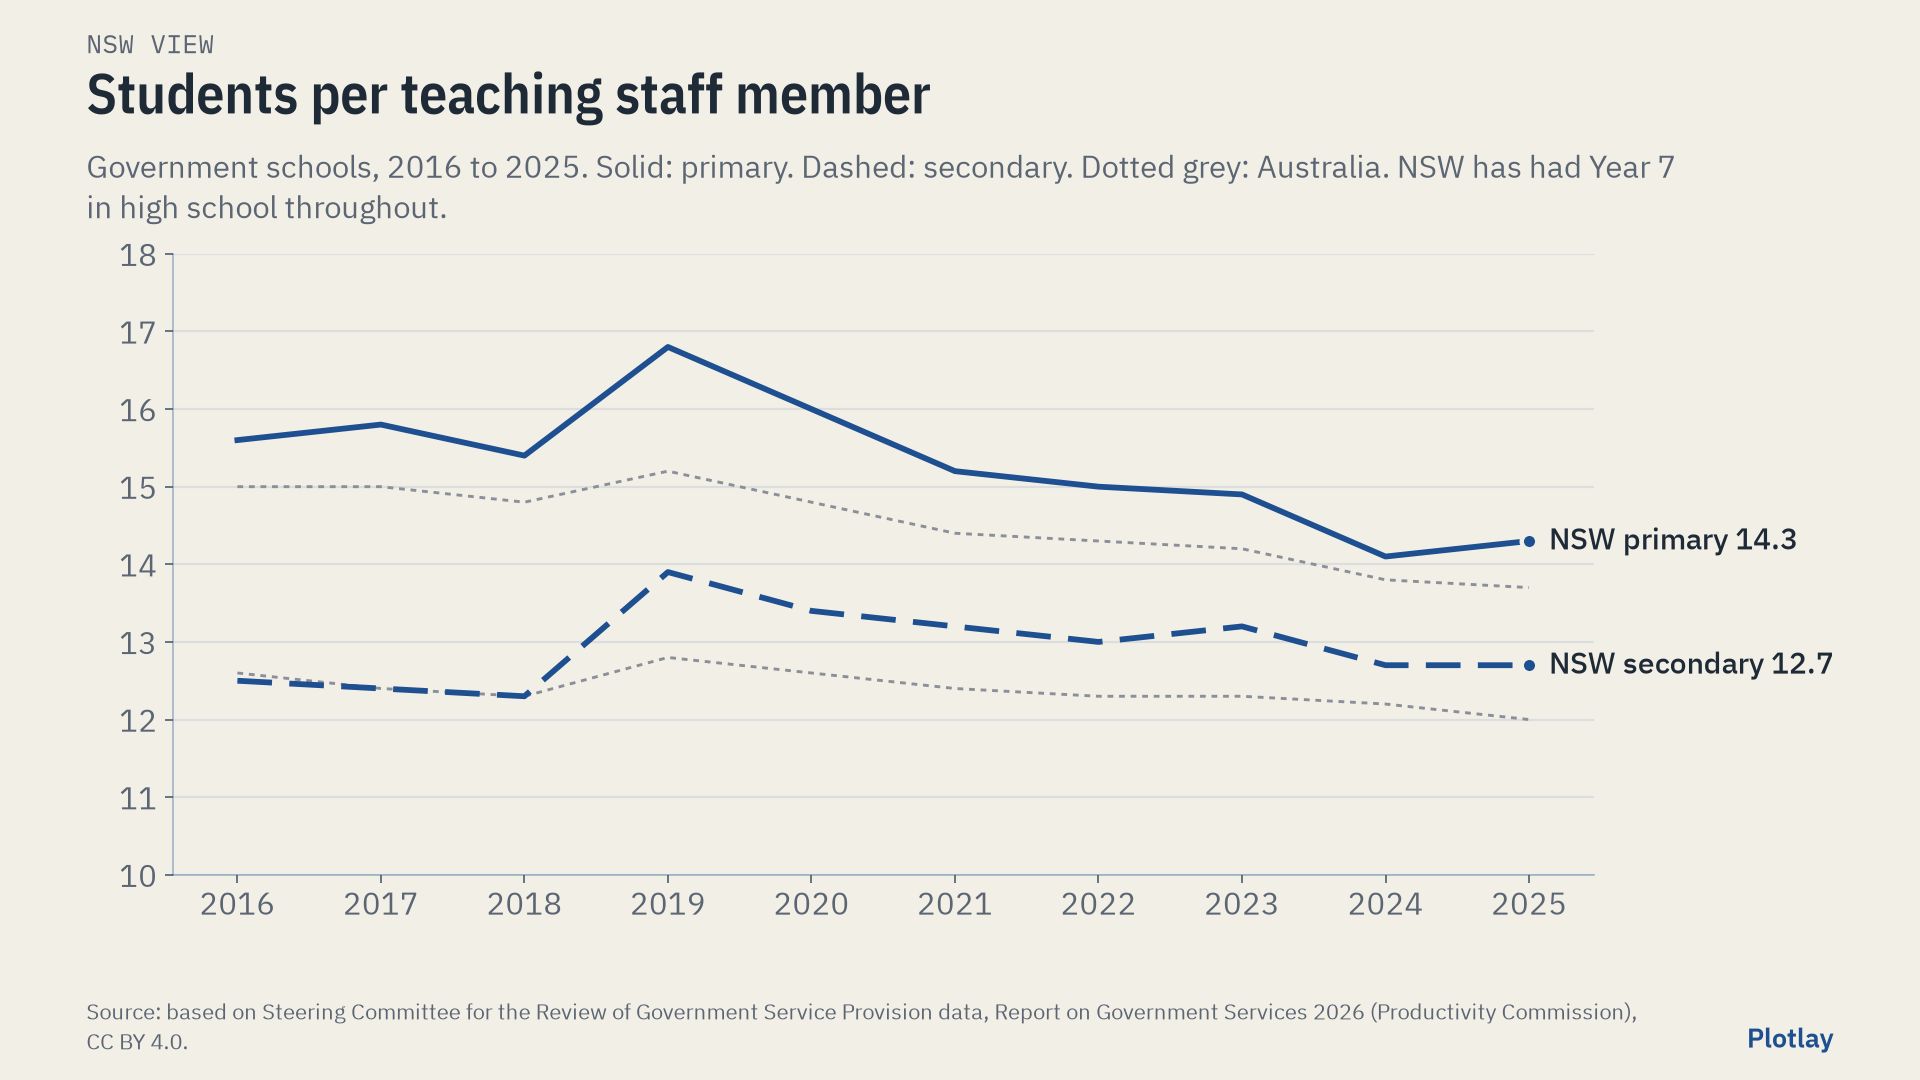
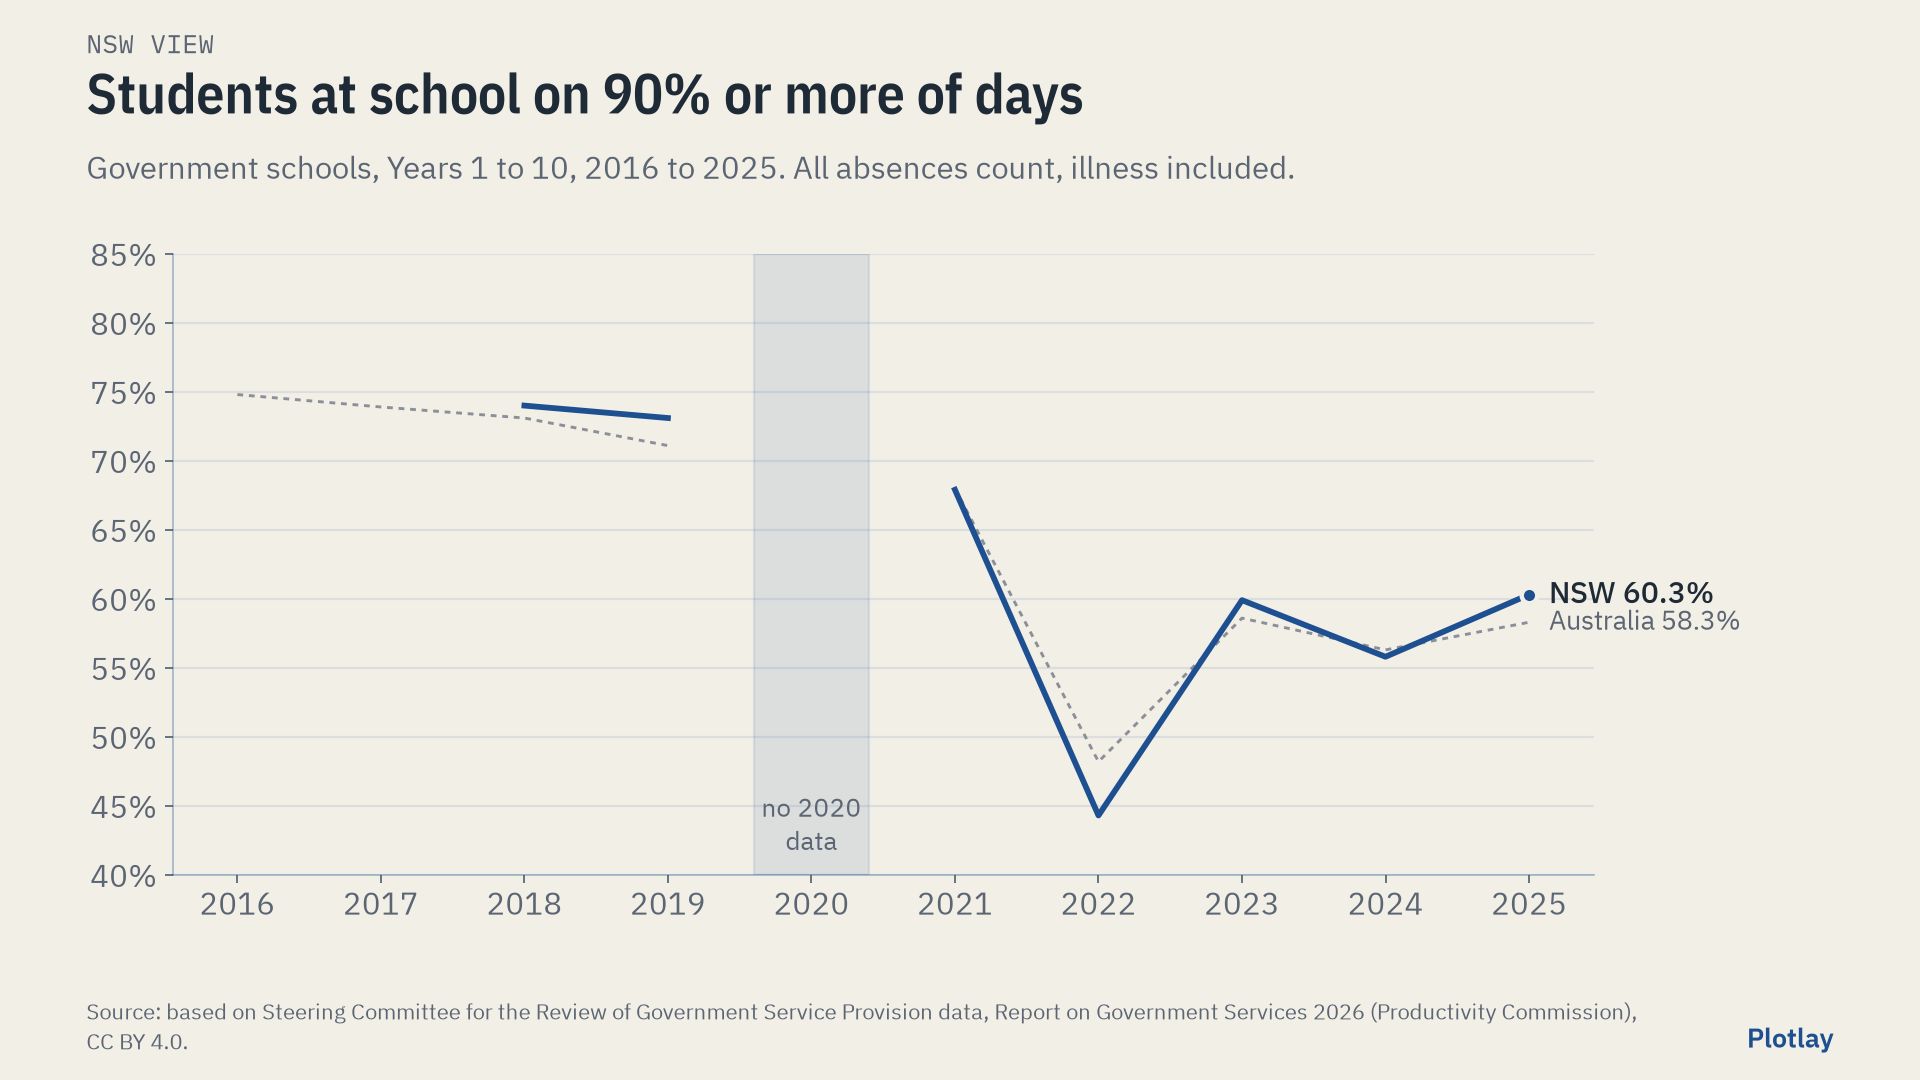
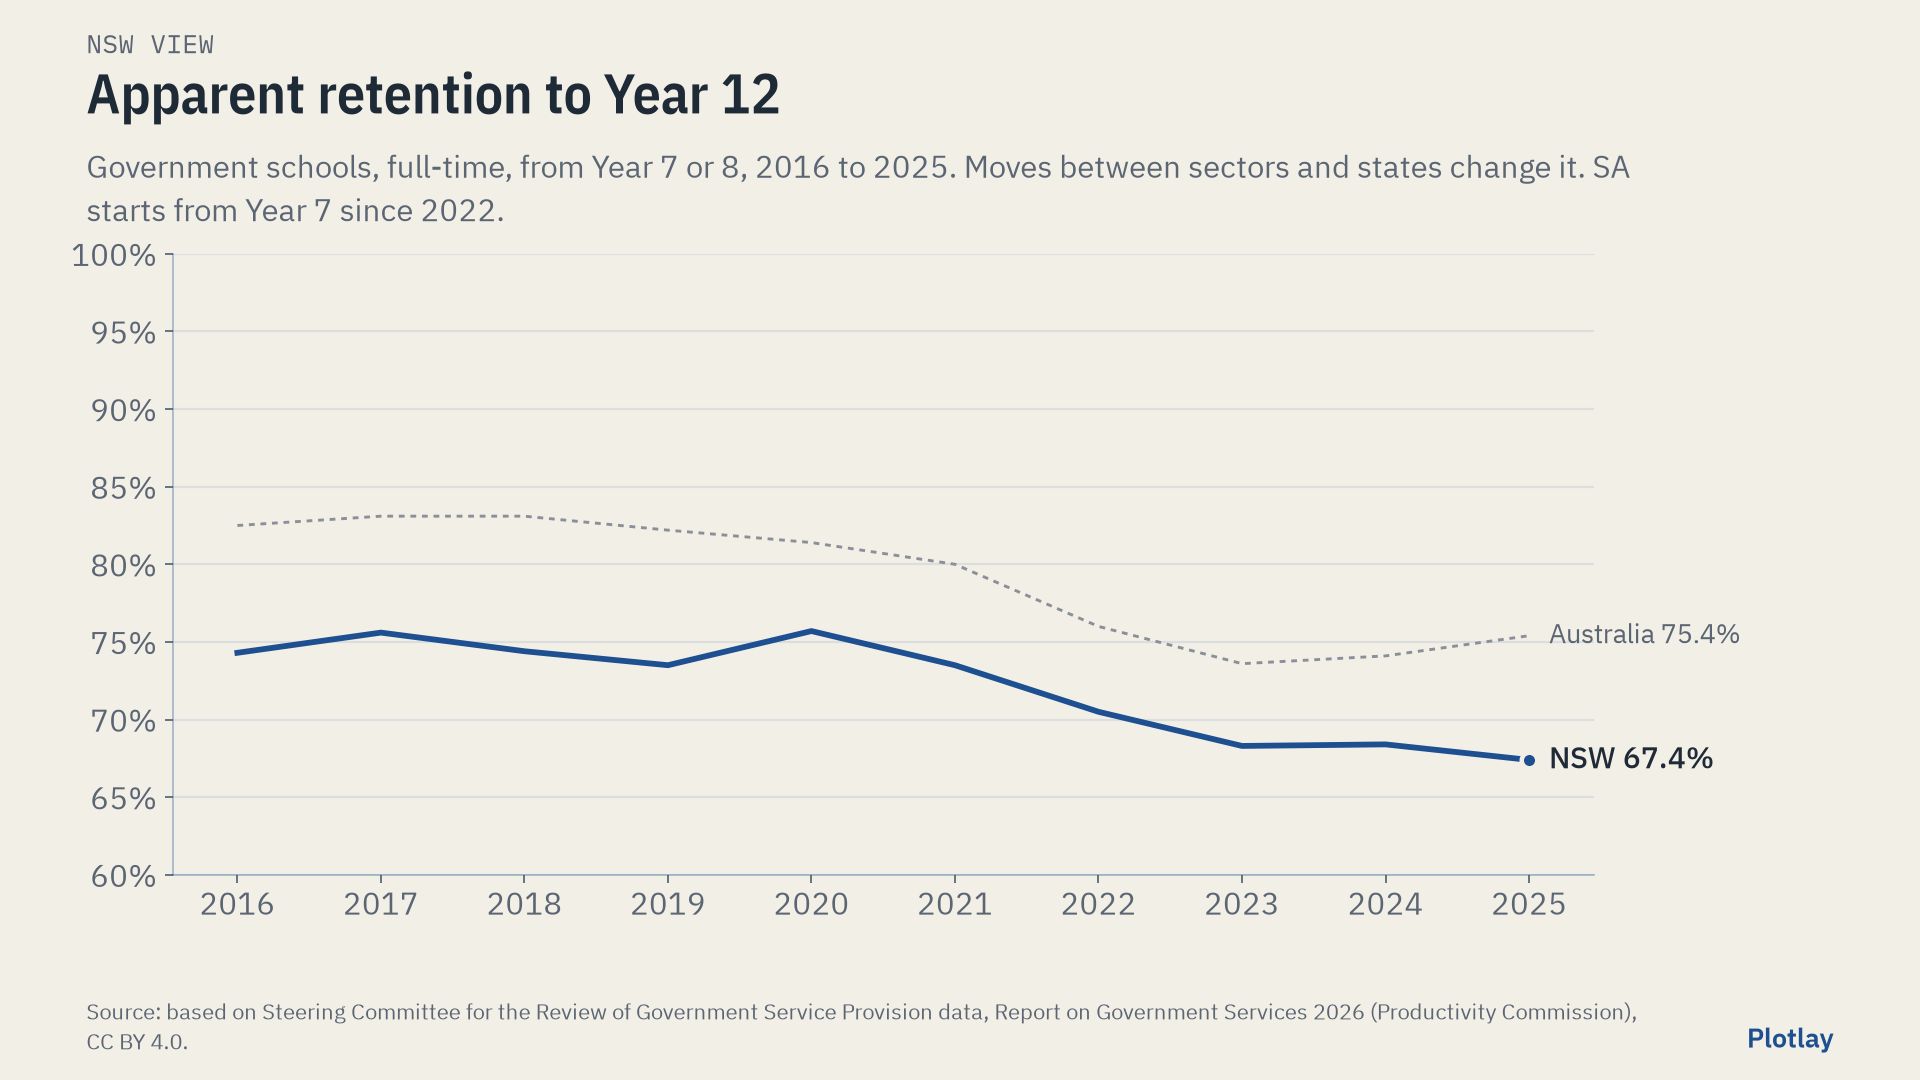
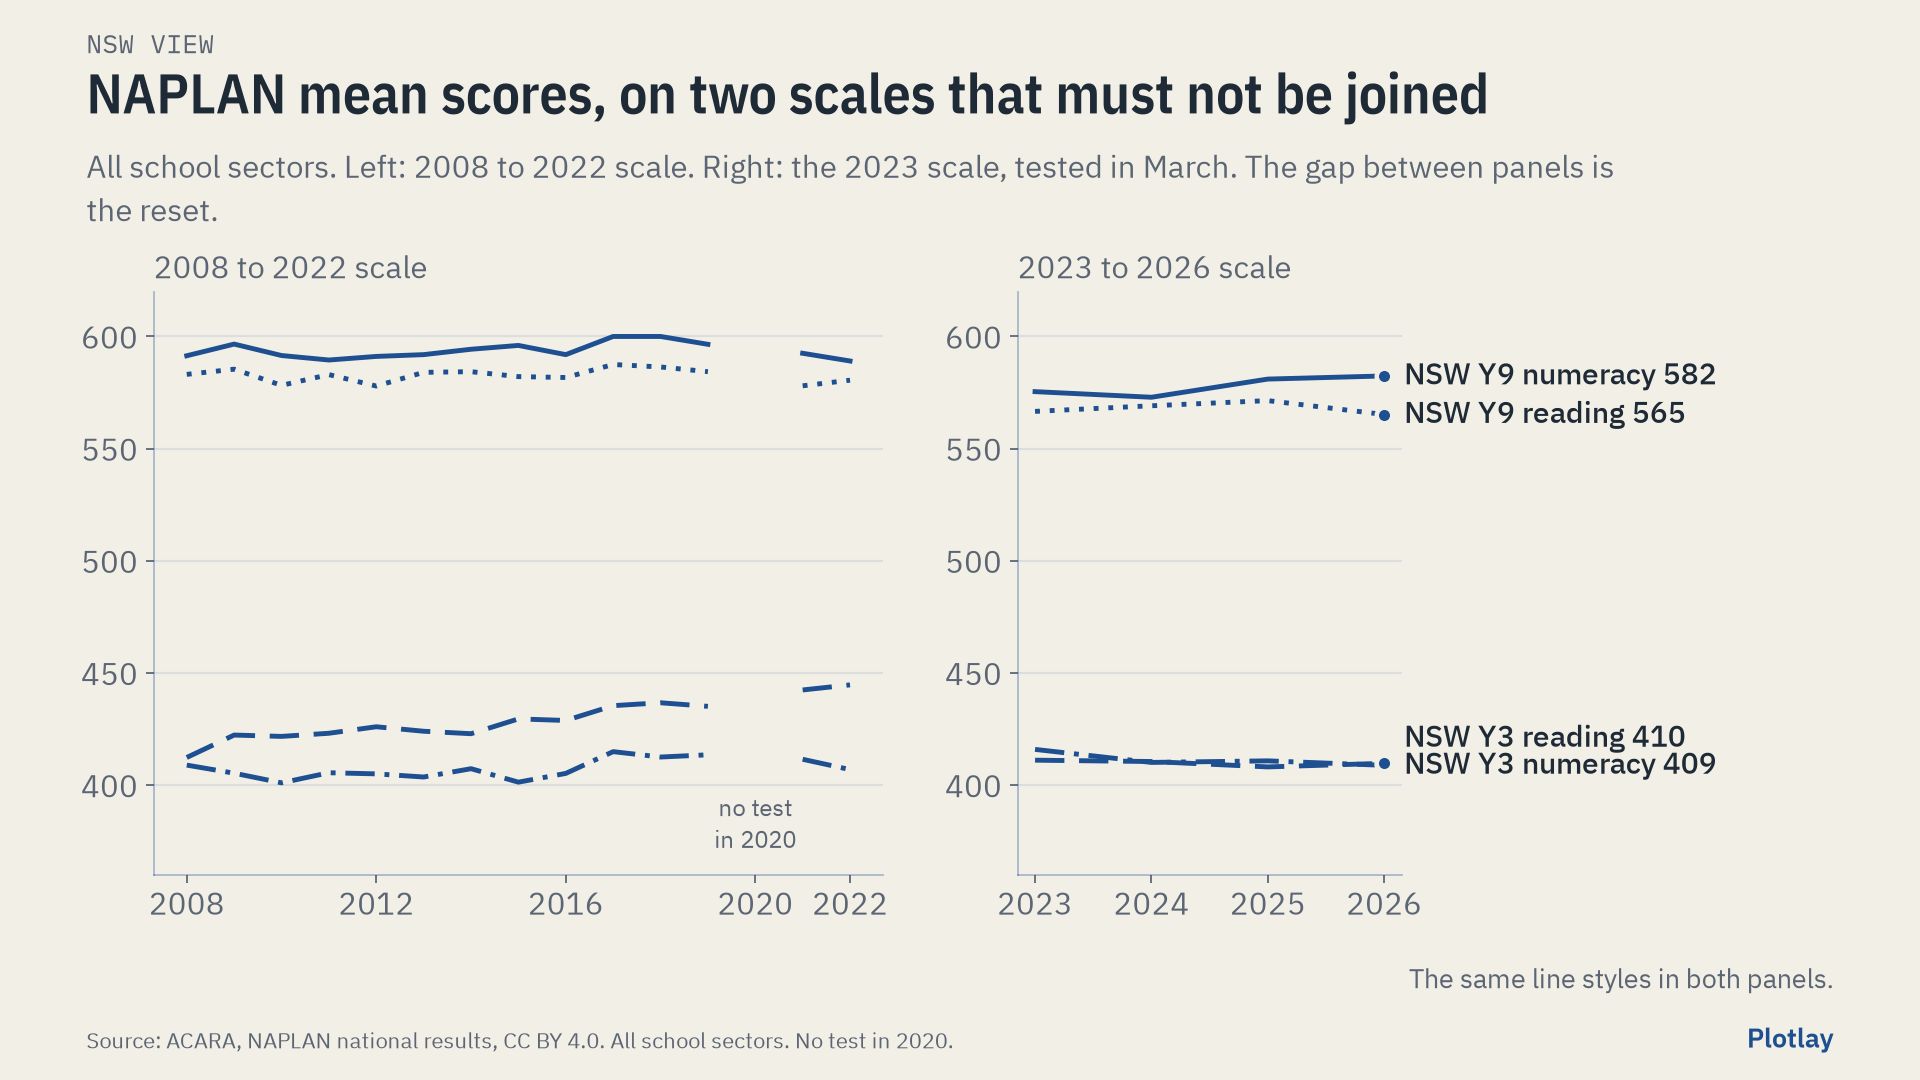
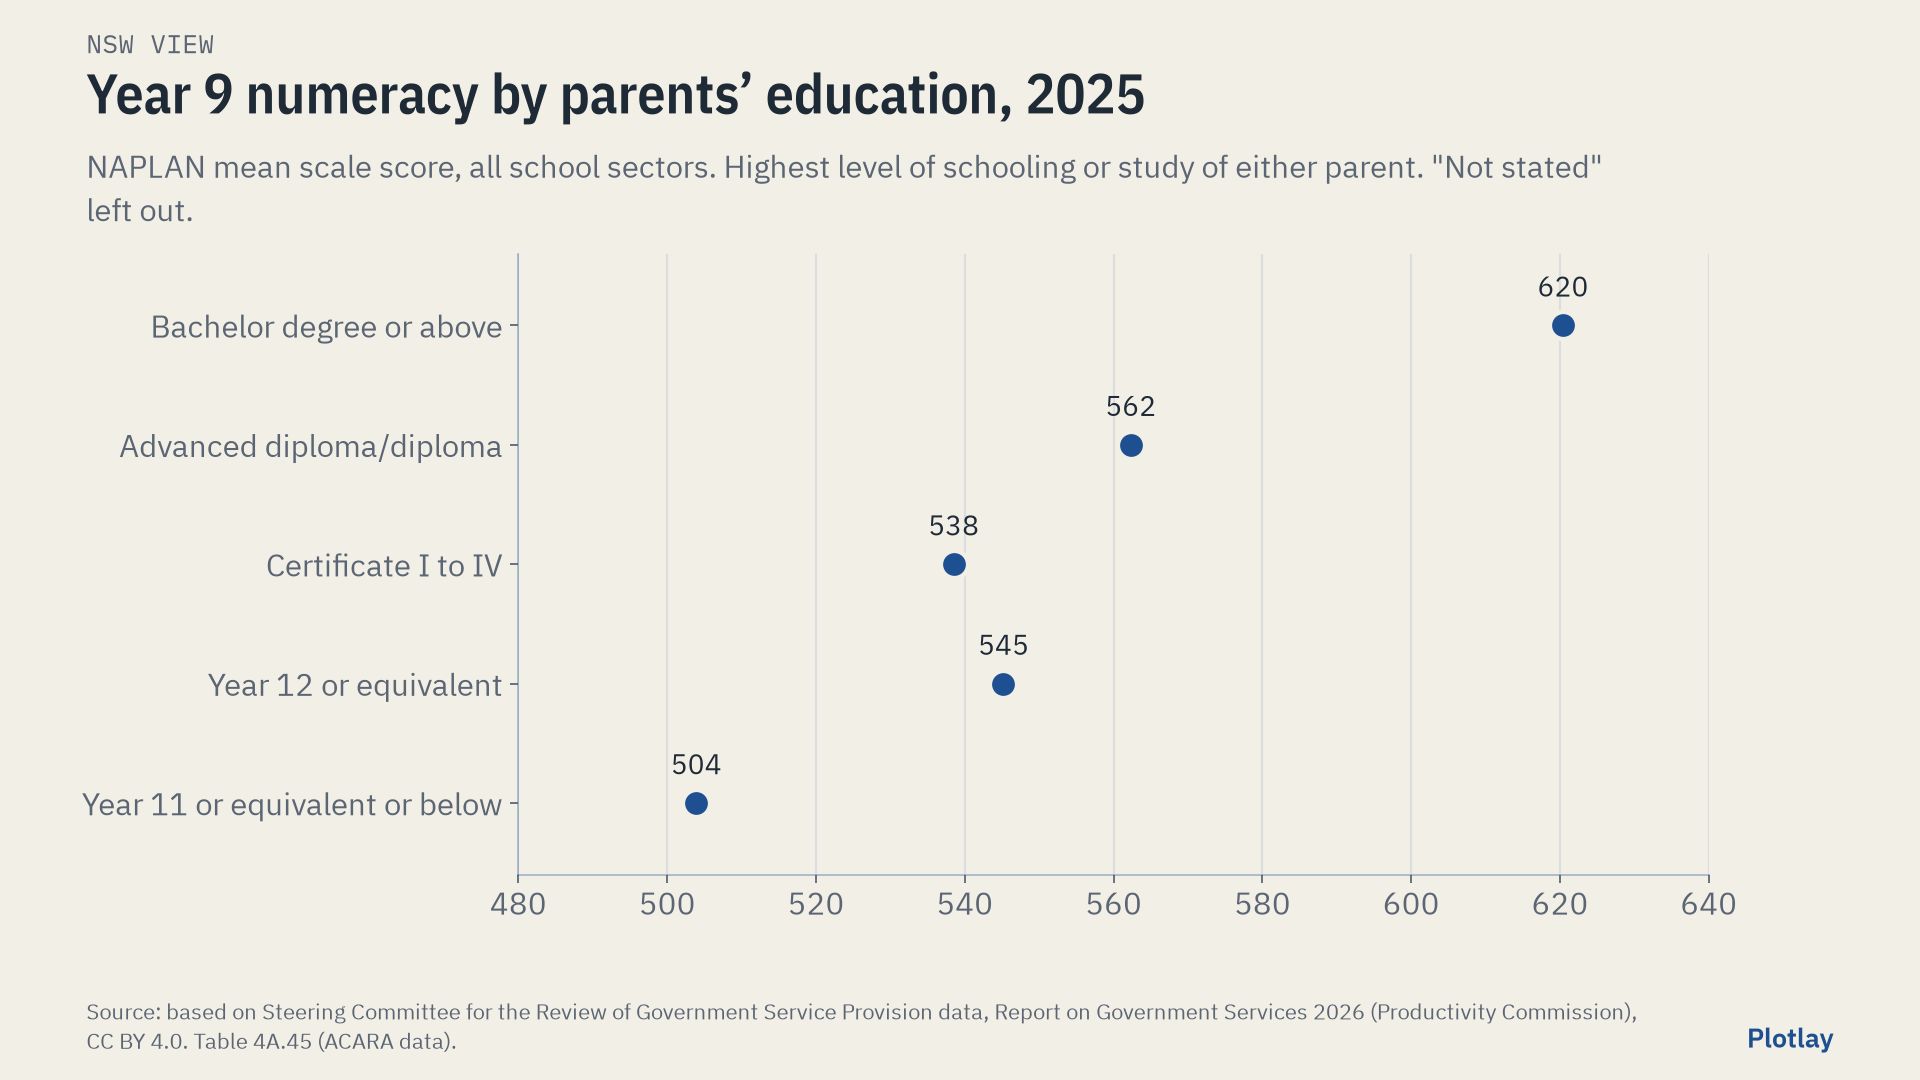
NSW only, no SA equivalent published
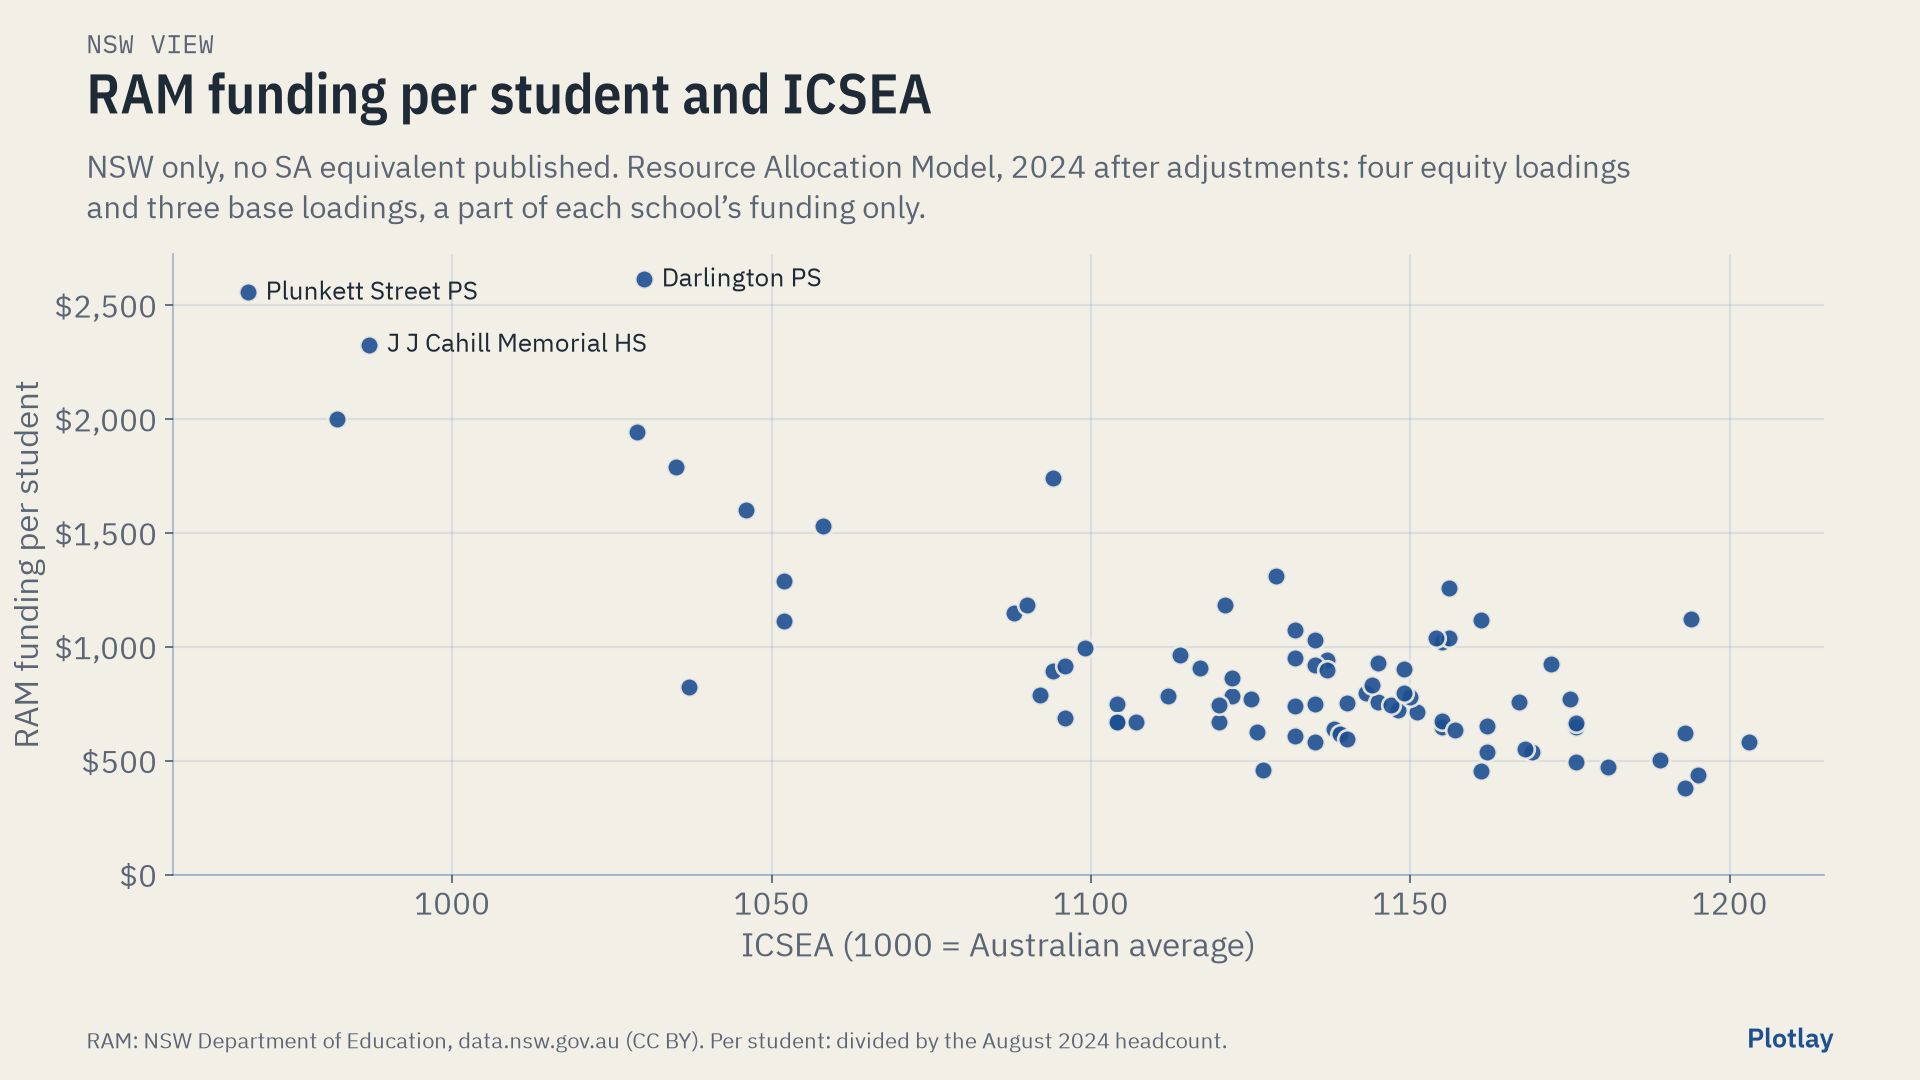
NSW publishes two more things per school that SA does not: ICSEA (ACARA’s index of community socio-educational advantage, republished in the NSW master dataset) and Resource Allocation Model funding. They stay here, in the NSW view, and out of the comparison. Across the 79 compared inner Sydney schools, grounds per student and ICSEA have a Spearman correlation of -0.36: a weak link, and no cause is implied. RAM funding covers four equity loadings and three base loadings, a part of each school’s funding only; its median is $783 per student.
View 2 of 3: the same analysis as view 1
SA on its own
Government schools in SA. Spending, staffing, attendance and retention are for SA’s government schools (Report on Government Services 2026); NAPLAN is all sectors (ACARA); grounds per student are for the 54 mainstream government schools within 7 km of Victoria Square, with outlines from SA Land Use Generalised 2025, picked in Plotlay with Pick from a layer.
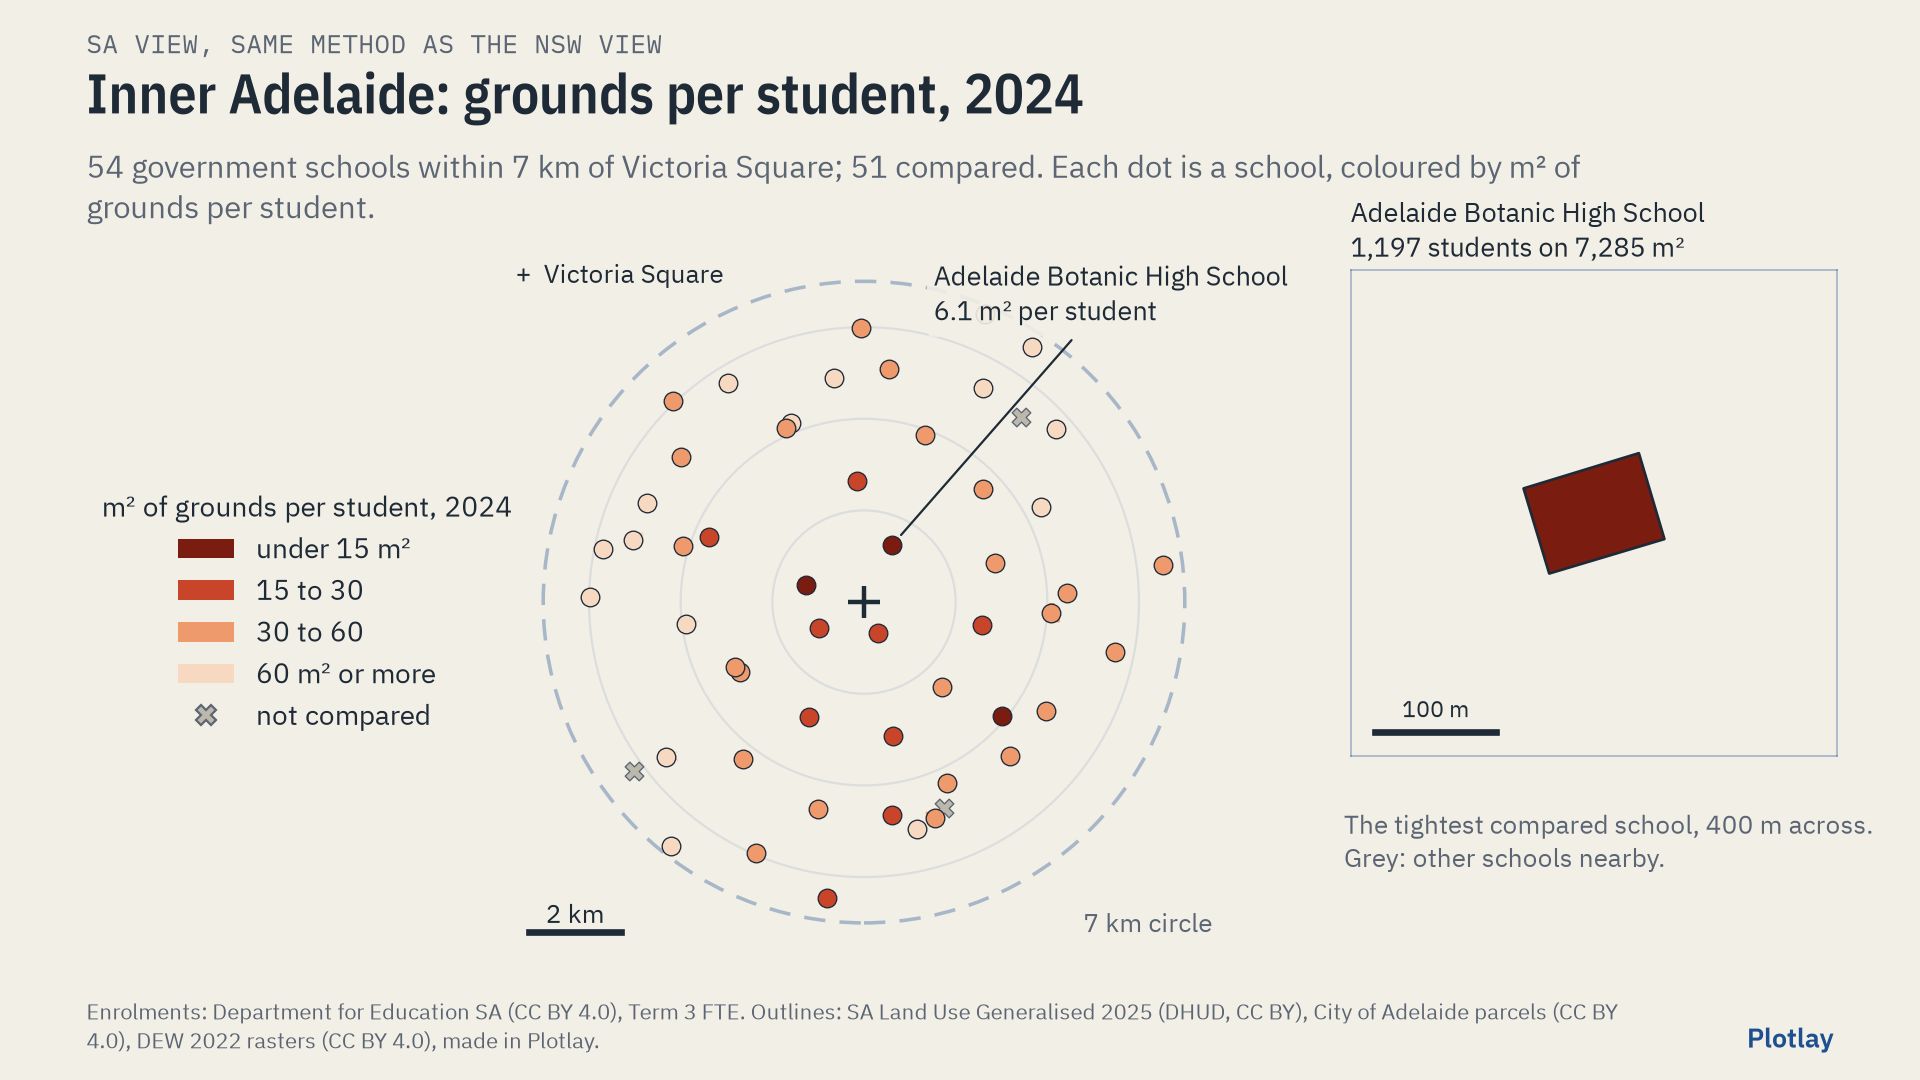
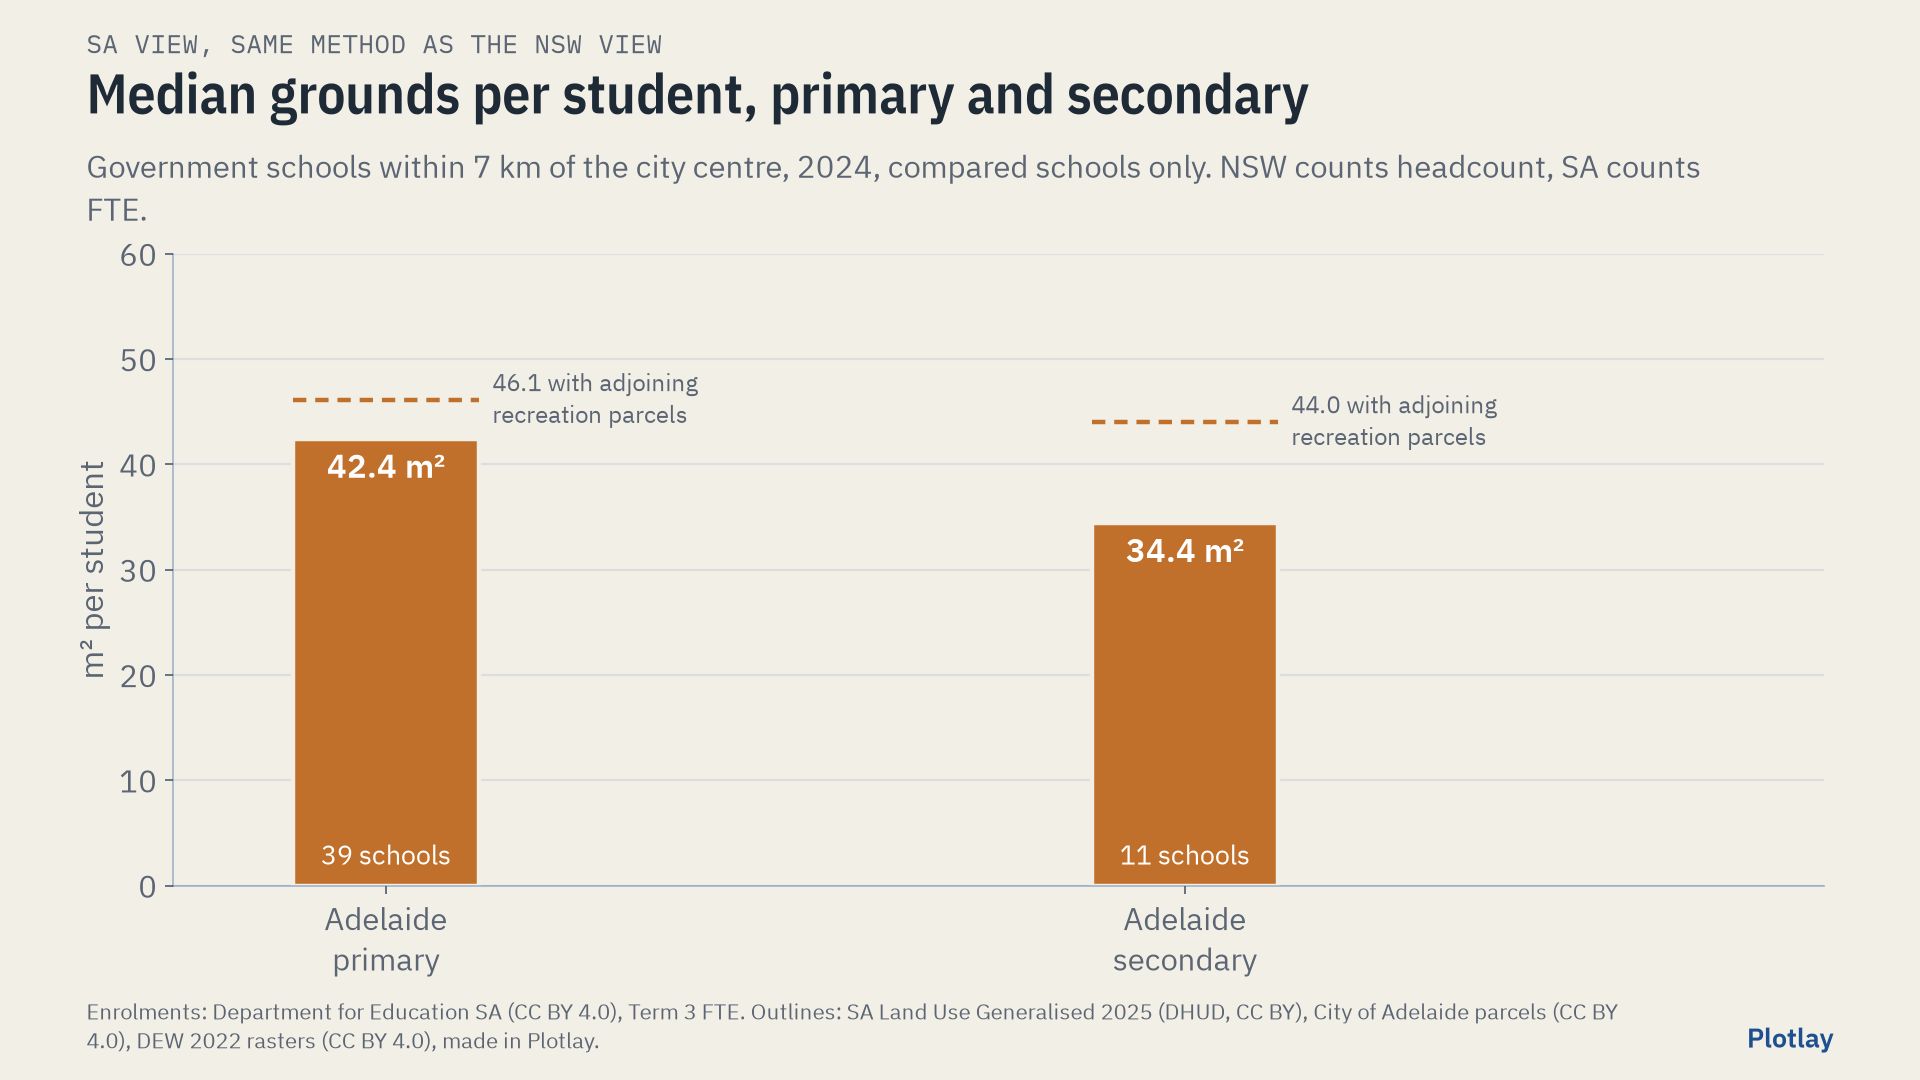
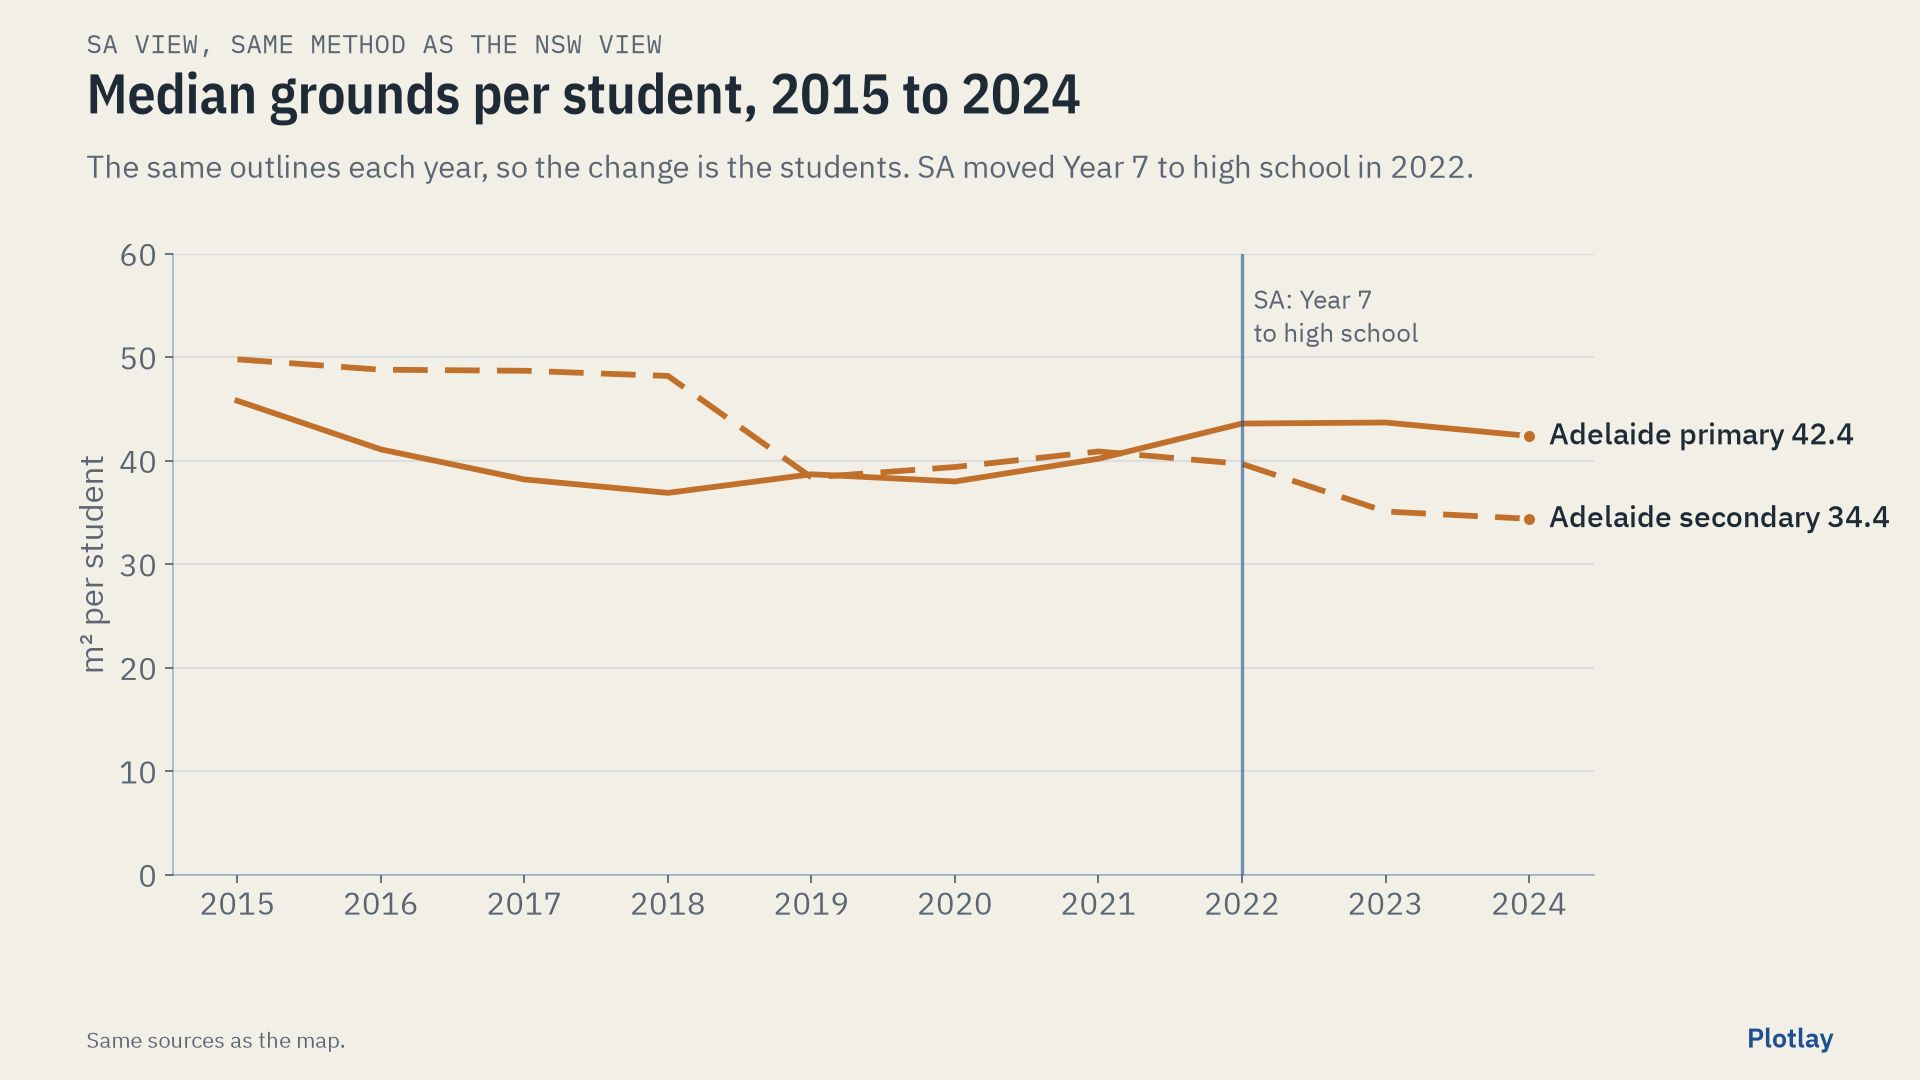
The tightest compared school is Adelaide Botanic High School: 1,197 students on 7,285 m², 6.1 m² each. 3 compared schools have under 15 m² per student. Medians: primary 42.4 m² (39 schools), secondary 34.4 m² (11).
Adelaide Botanic High School opened in 2019 with two year groups and has had all of them since 2022, so in 2024 it is compared like any other school.
Six schools touch a recreation parcel that may be their oval (Norwood Primary, Glenunga, Black Forest, Mitcham Girls, Felixstow, Colonel Light Gardens). Open data does not say who owns or uses them, so they are left out above. With them added, the medians are 46.1 m² (primary) and 44.0 m² (secondary): an upper bound.
View 3 of 3
NSW and SA side by side
The two maps below are at the same scale, with the same 7 km circle, the same classes and the same year. Hover over a school, or tap it, for its numbers; the slider moves both cities.
Inner Sydney (NSW)
Inner Adelaide (SA)
| Government schools | NSW | SA | SA minus NSW |
|---|---|---|---|
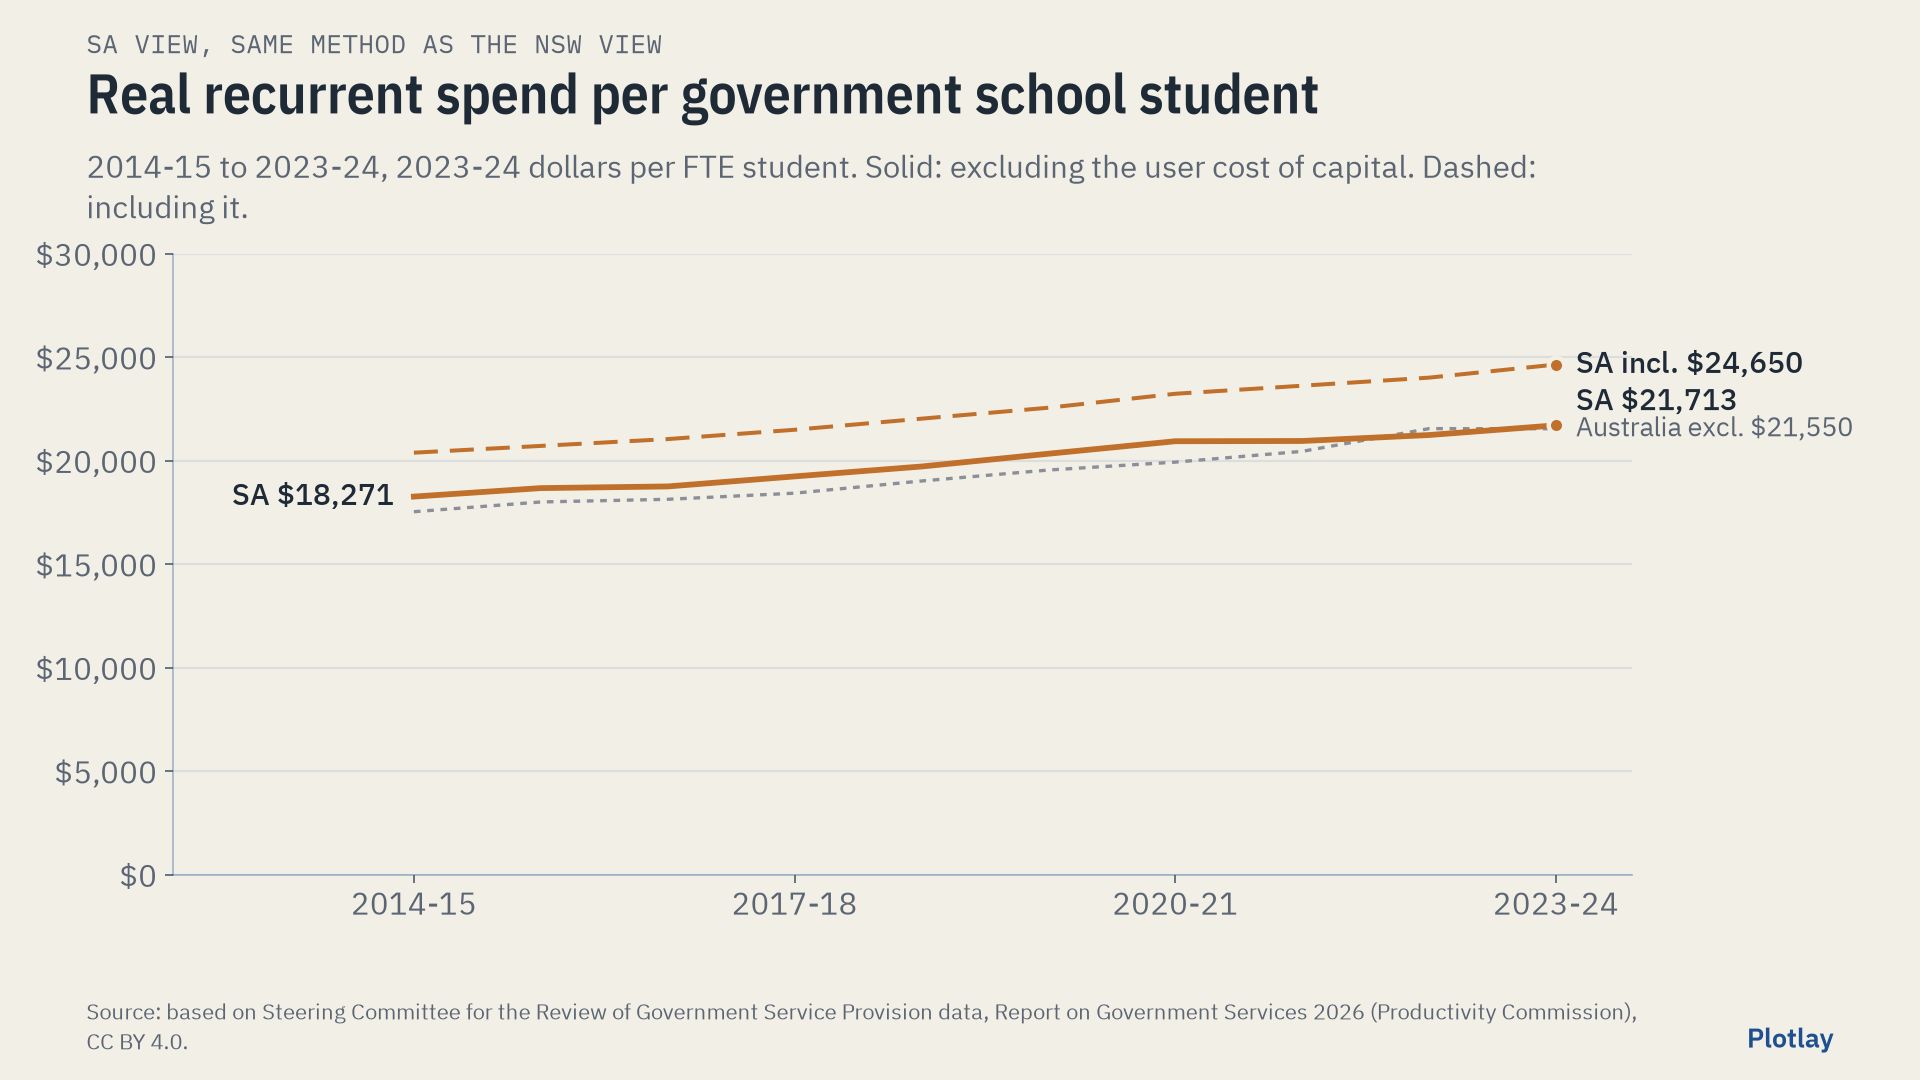
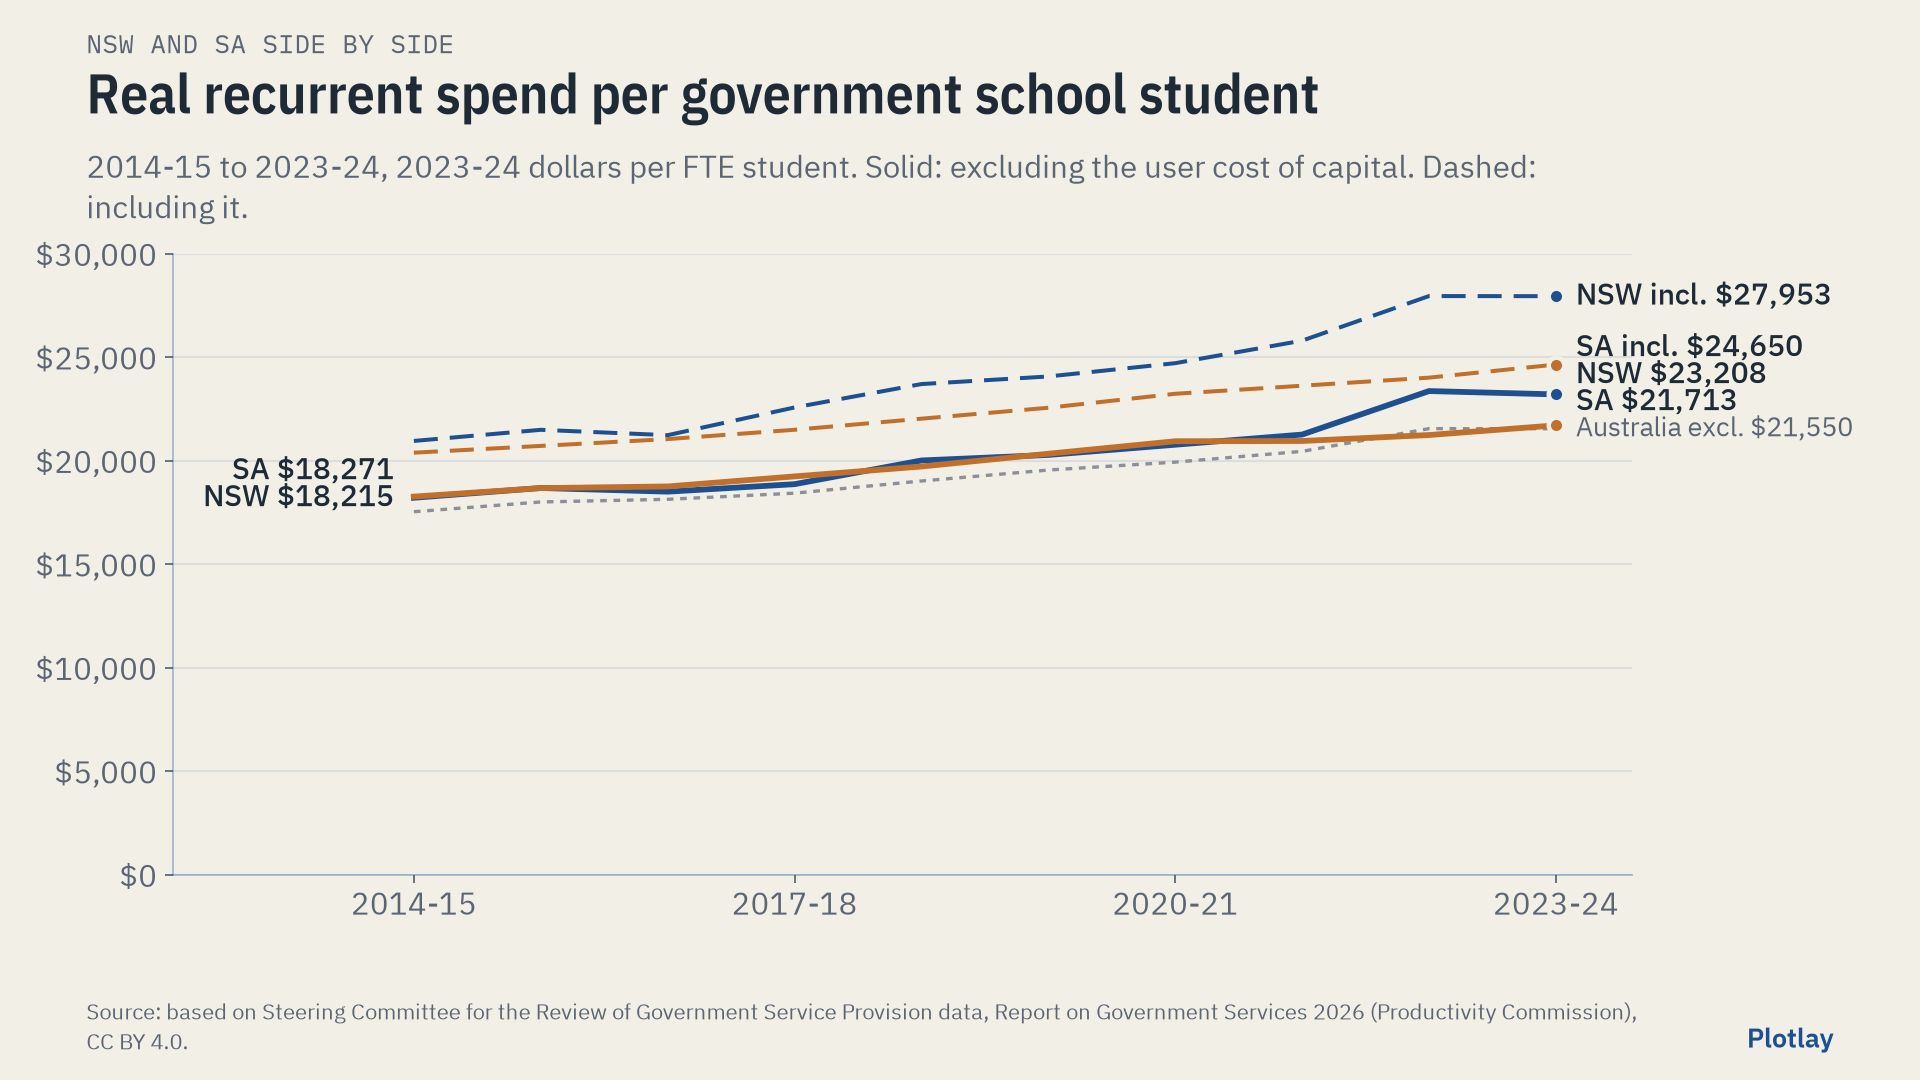
| Real spend per FTE student, excluding UCC, 2014-15 | $18,215 | $18,271 | +$56 |
| Same, 2023-24 | $23,208 | $21,713 | -$1,495 (93.6%) |
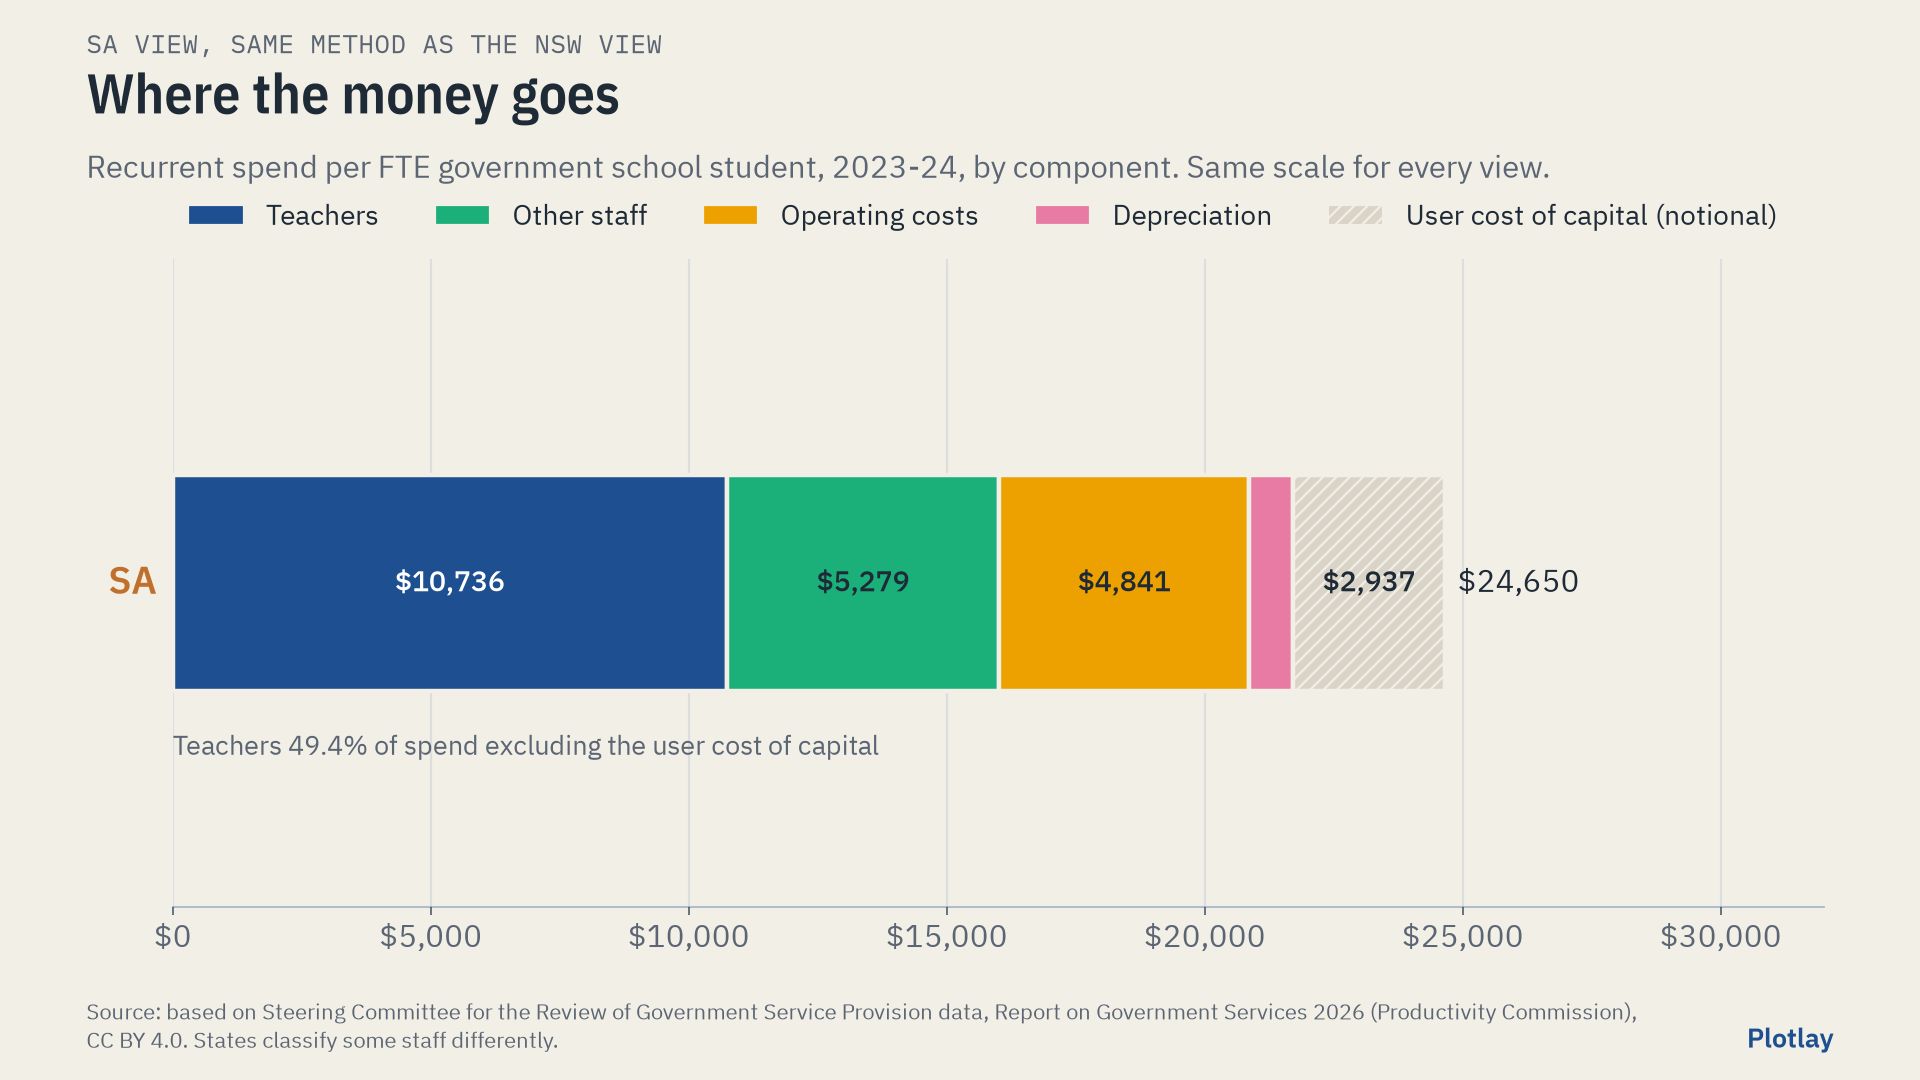
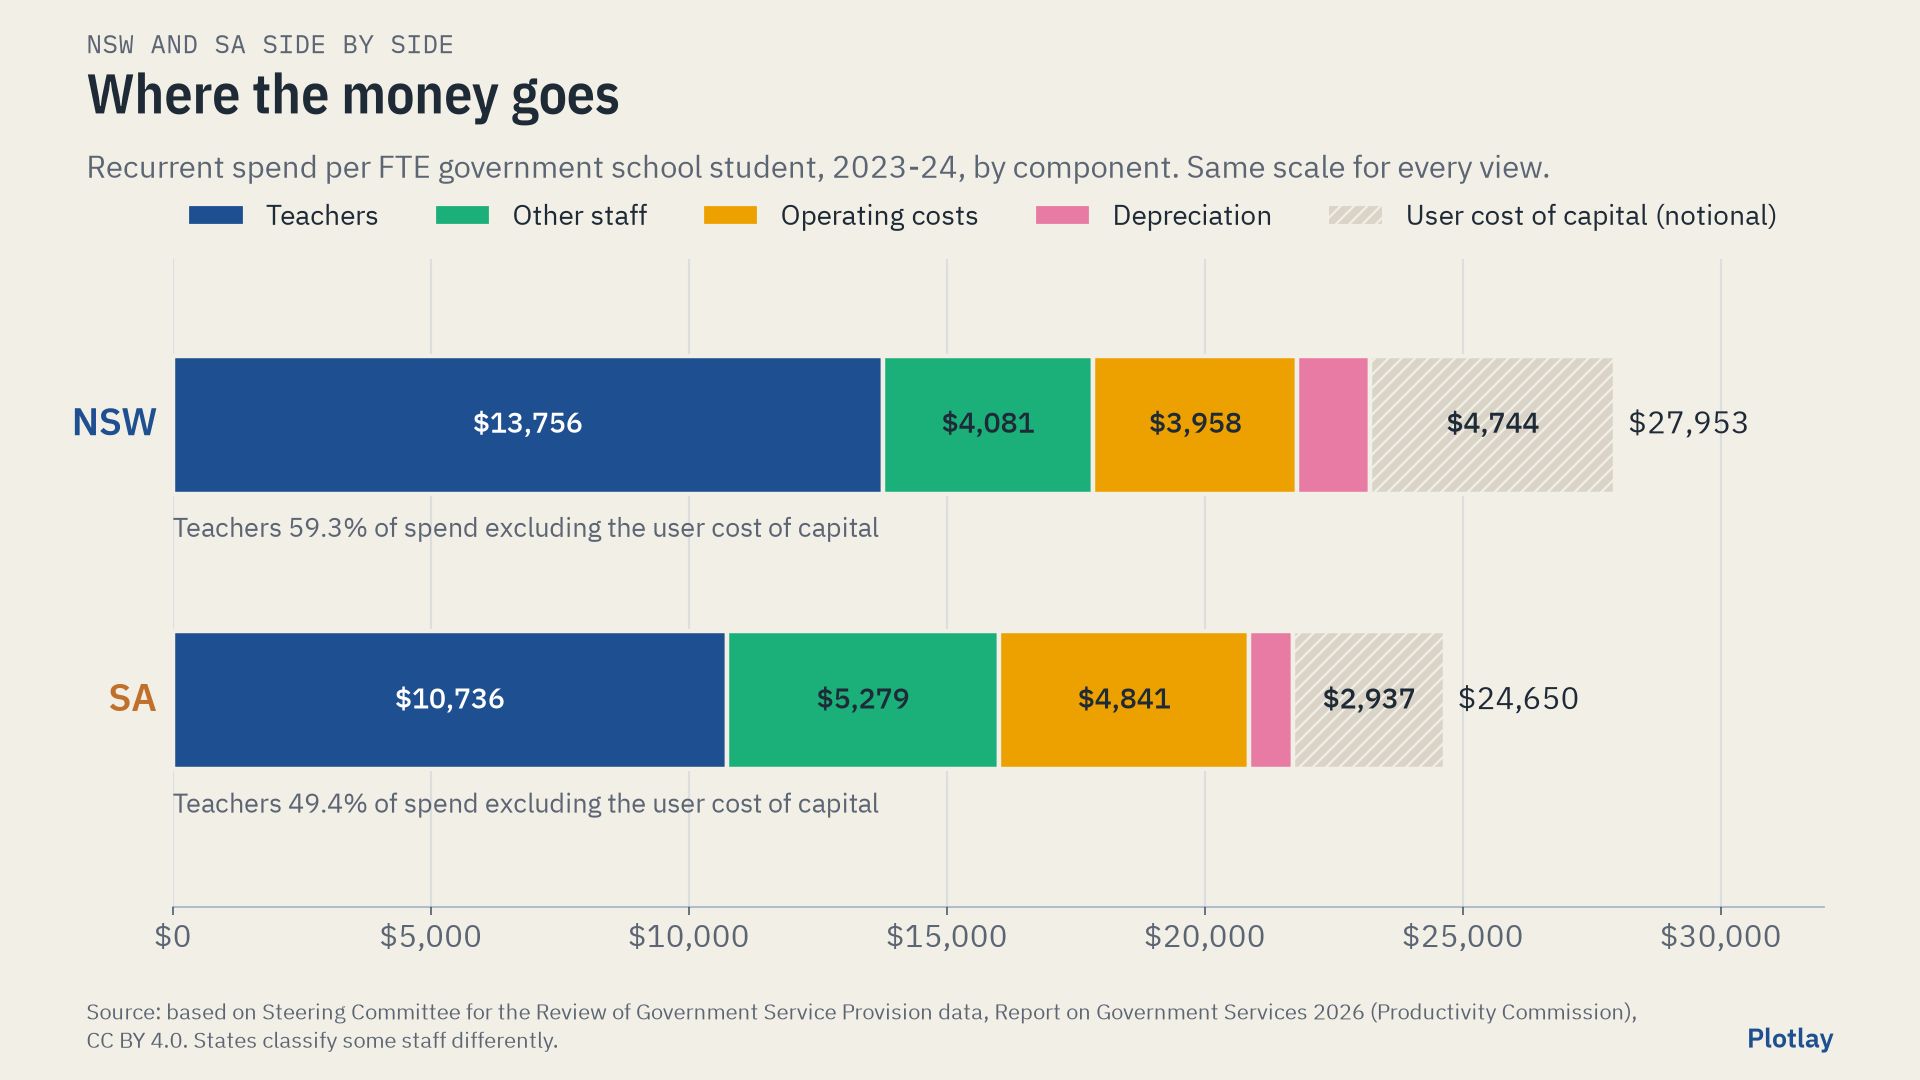
| Teachers’ share of spend, 2023-24 | 59.3% | 49.4% | -9.9 points |
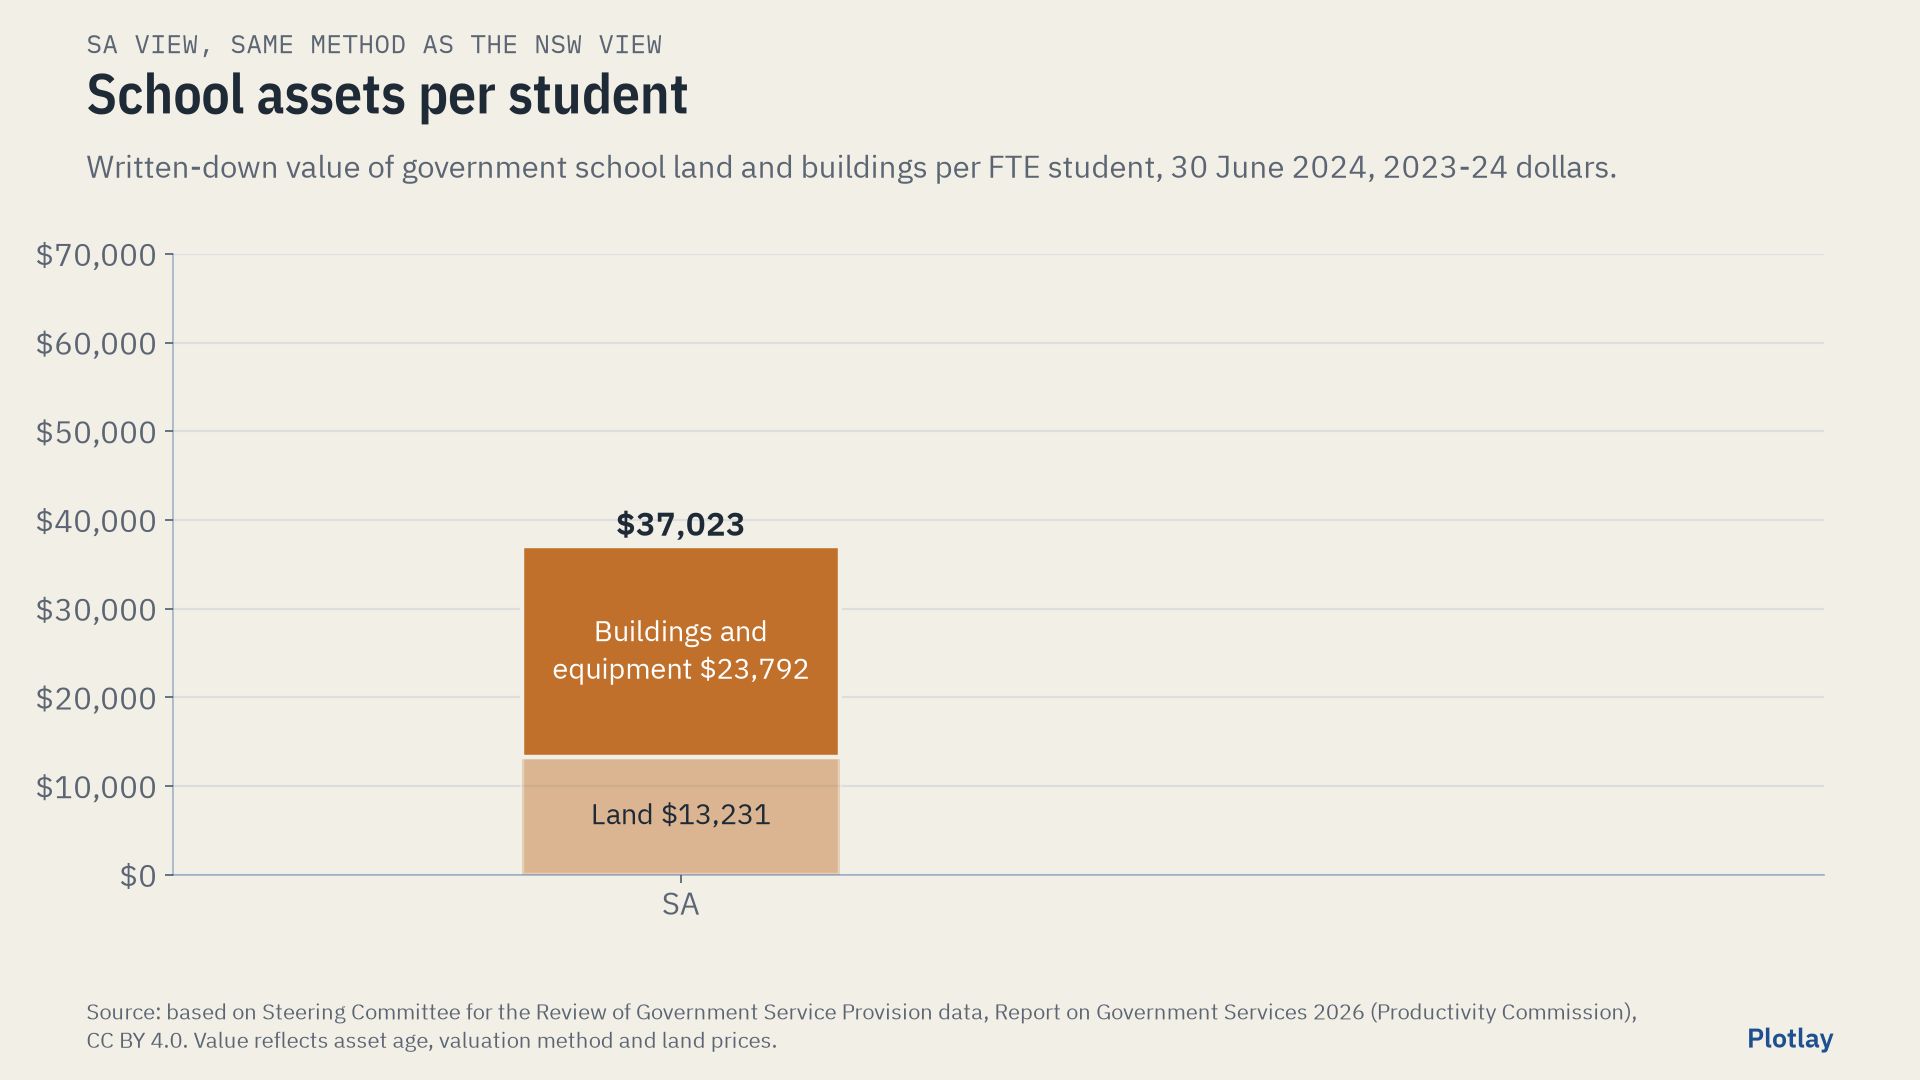
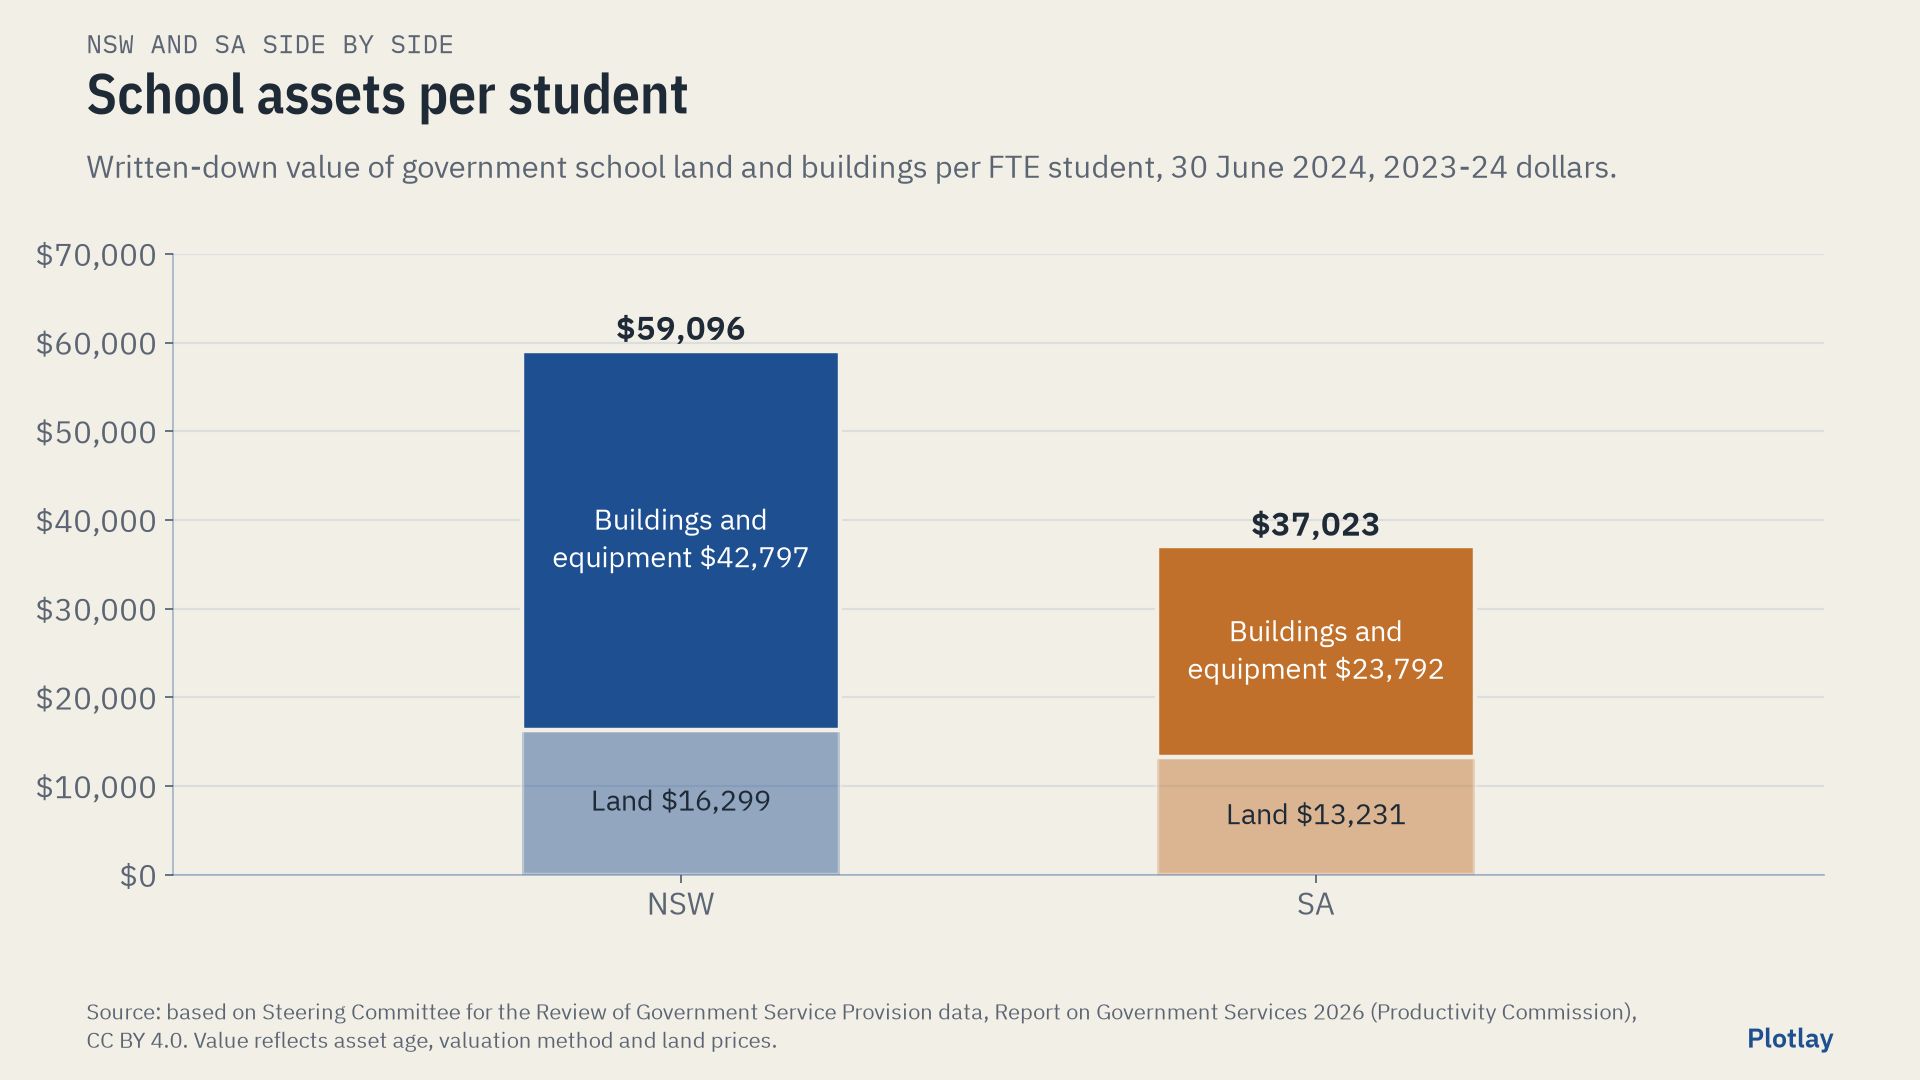
| School assets per FTE student, 2024 | $59,096 | $37,023 | -$22,073 |
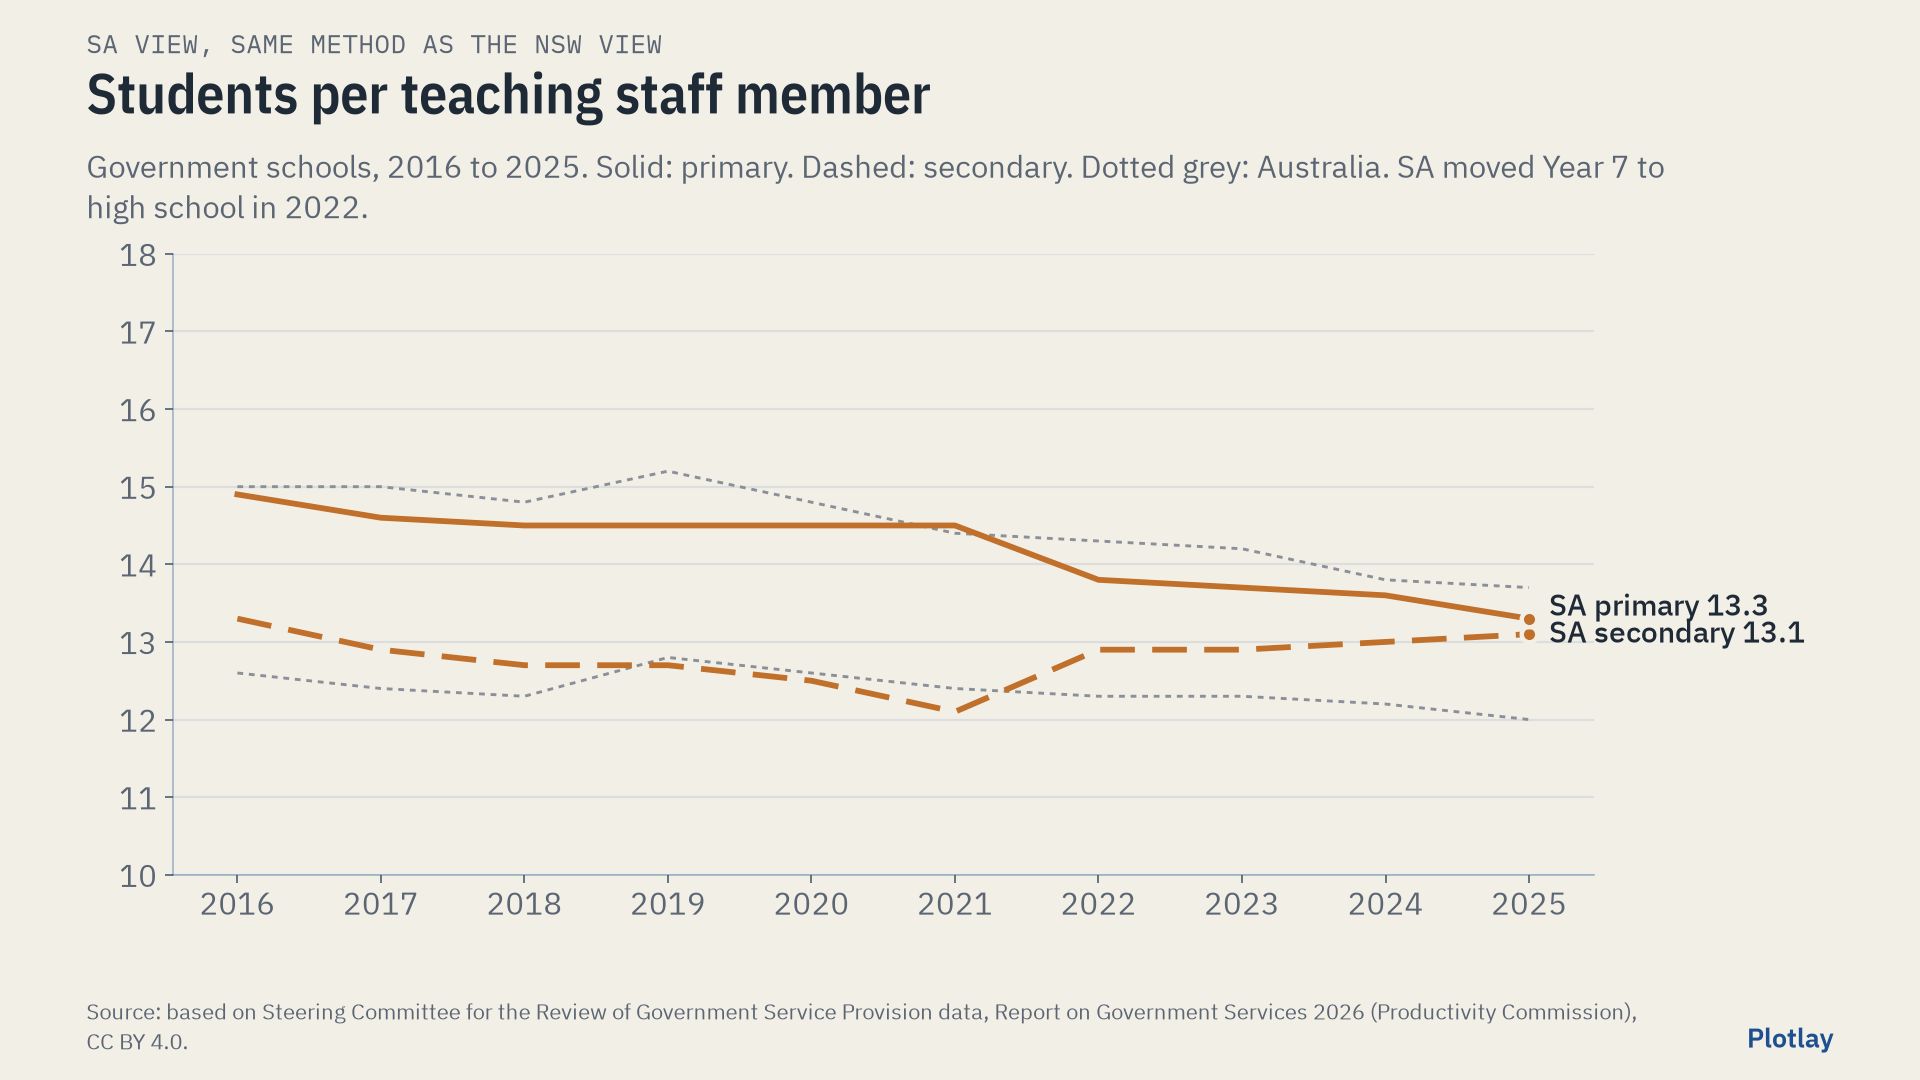
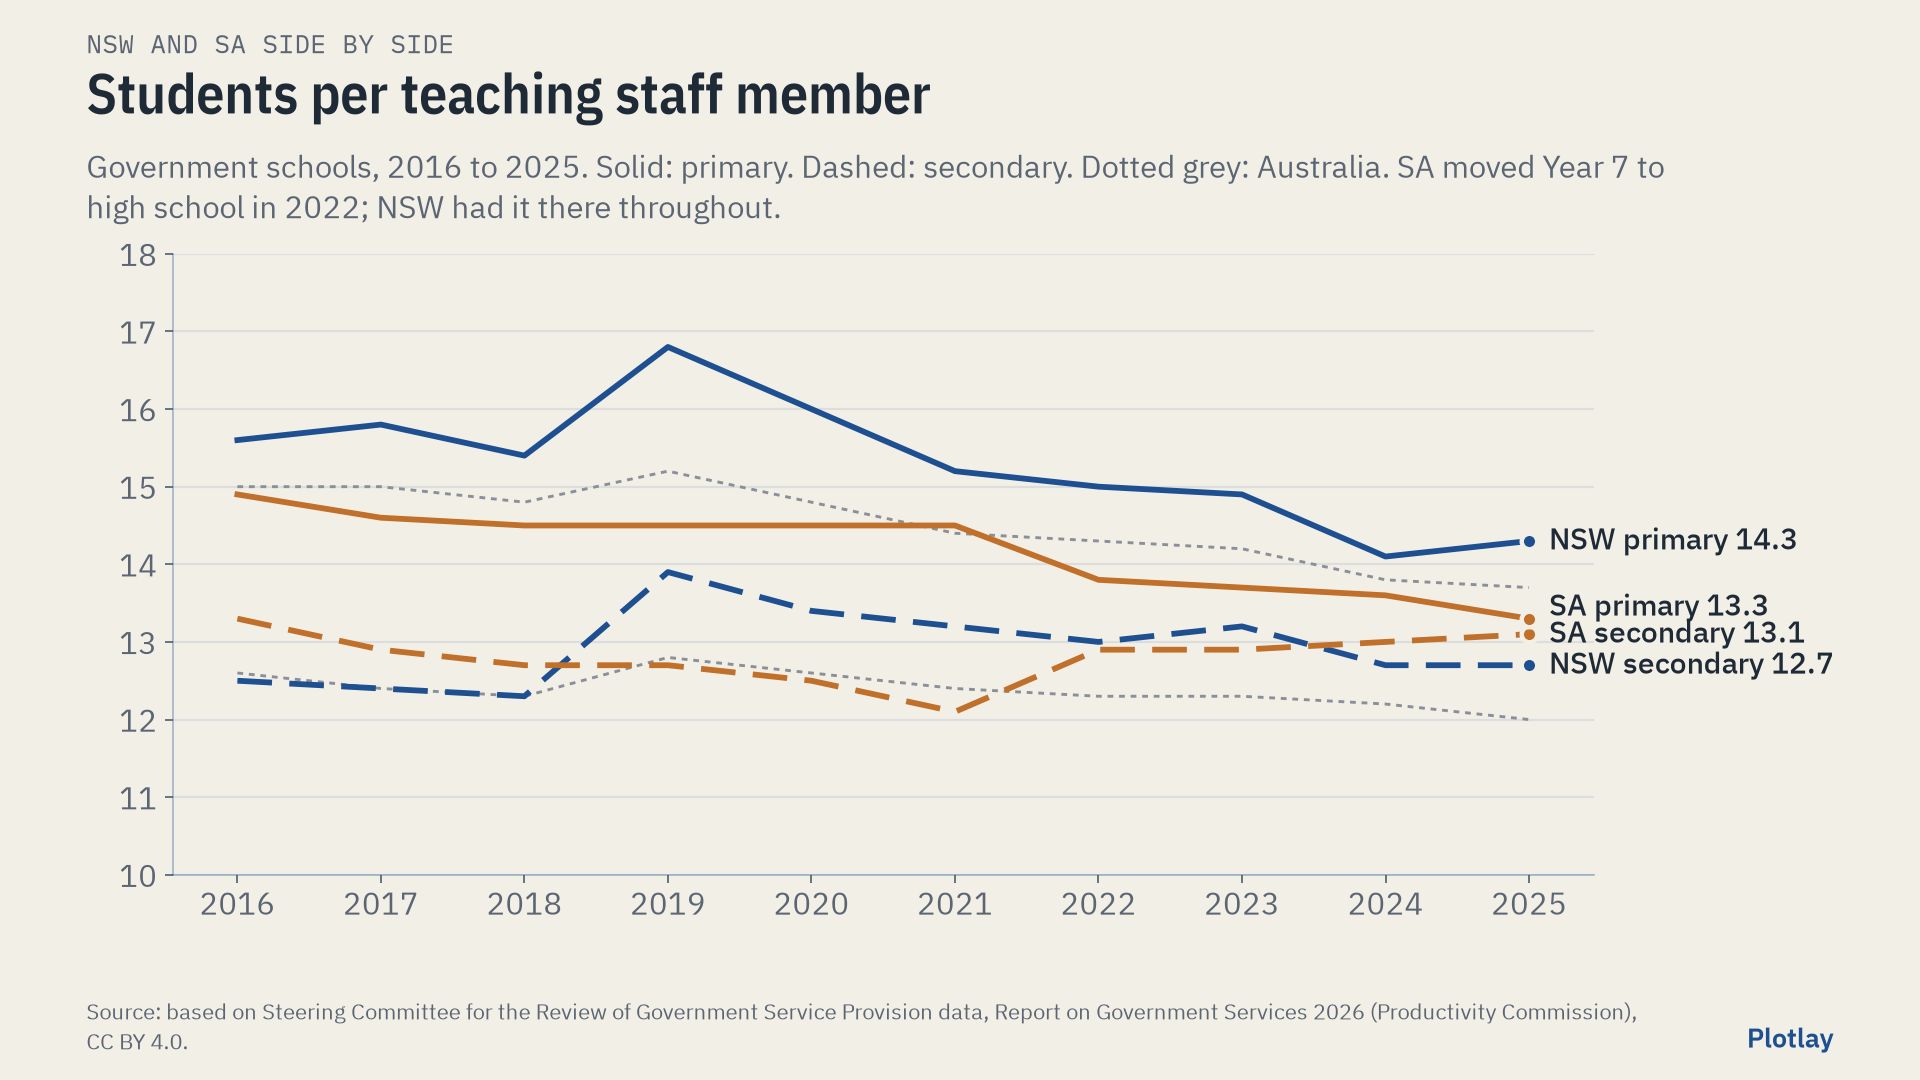
| Students per teaching staff member, 2025 | 13.6 | 13.2 | -0.4 |
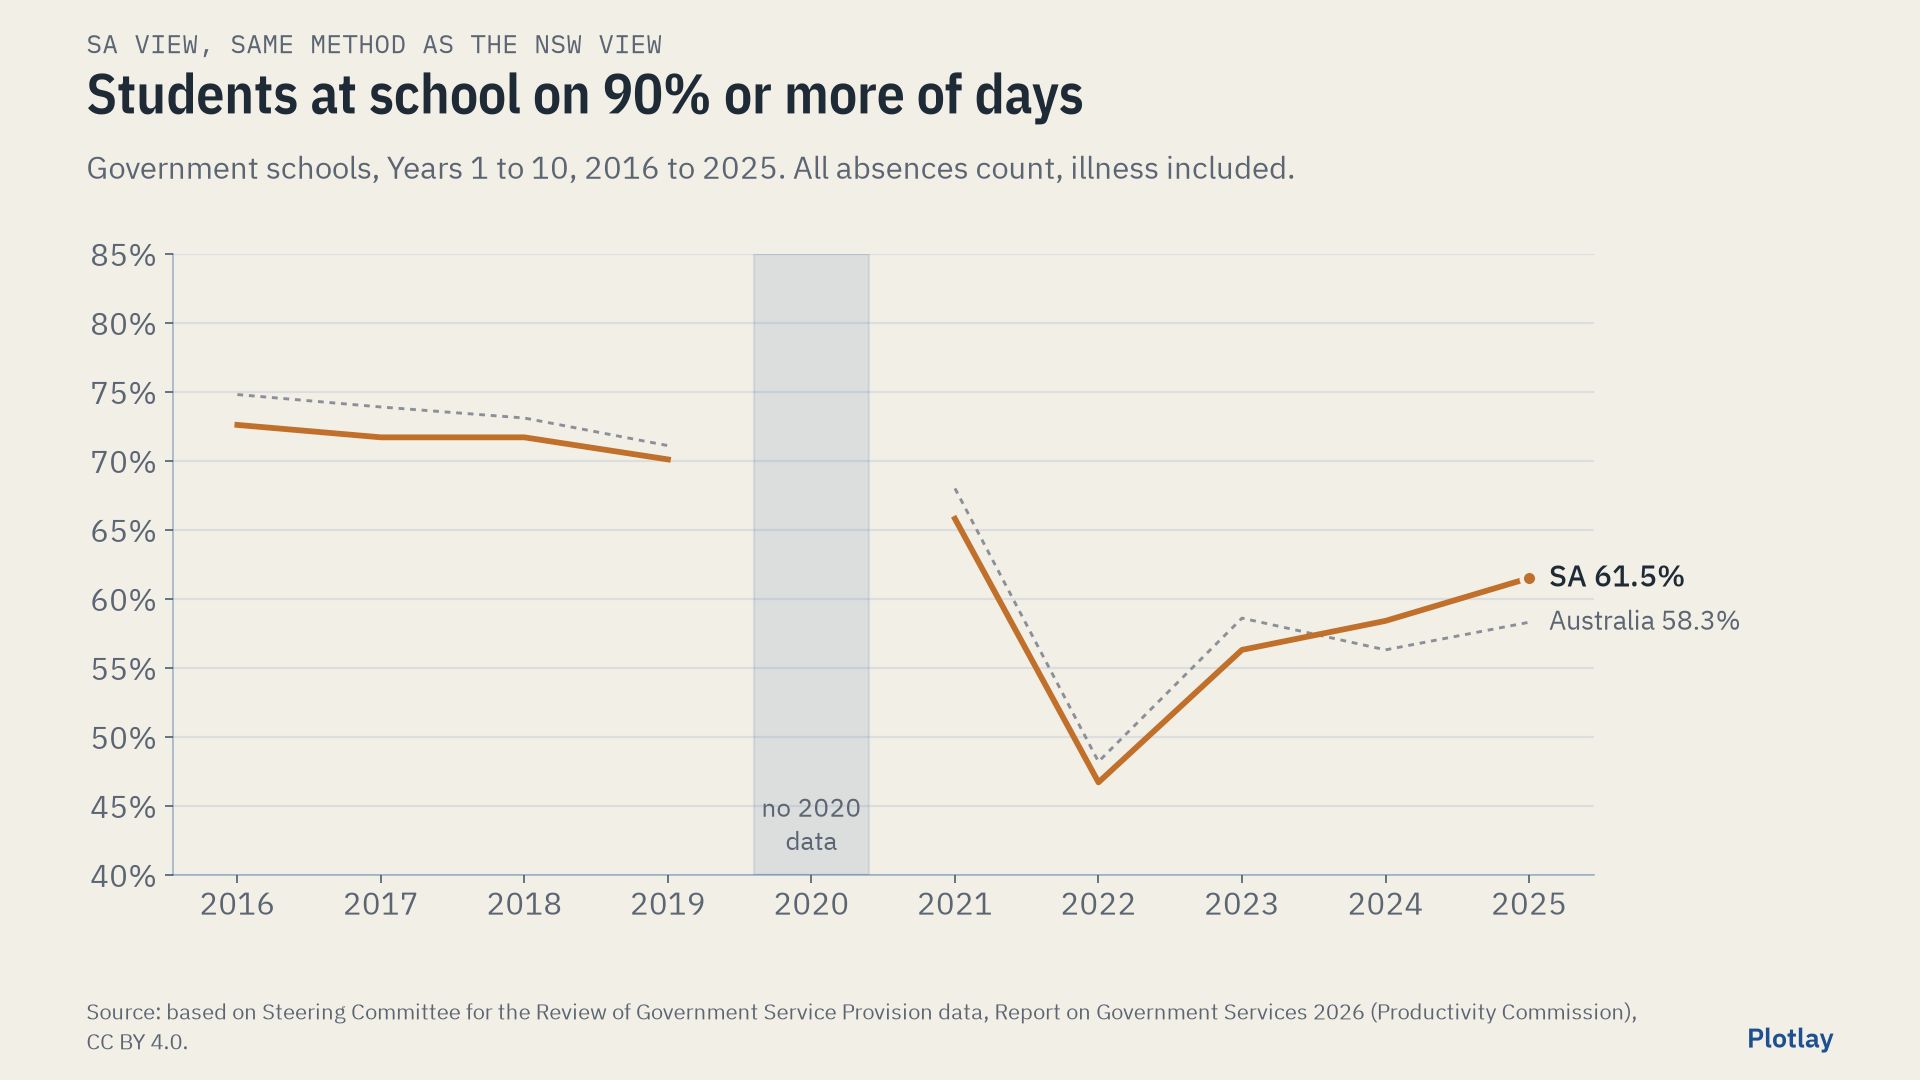
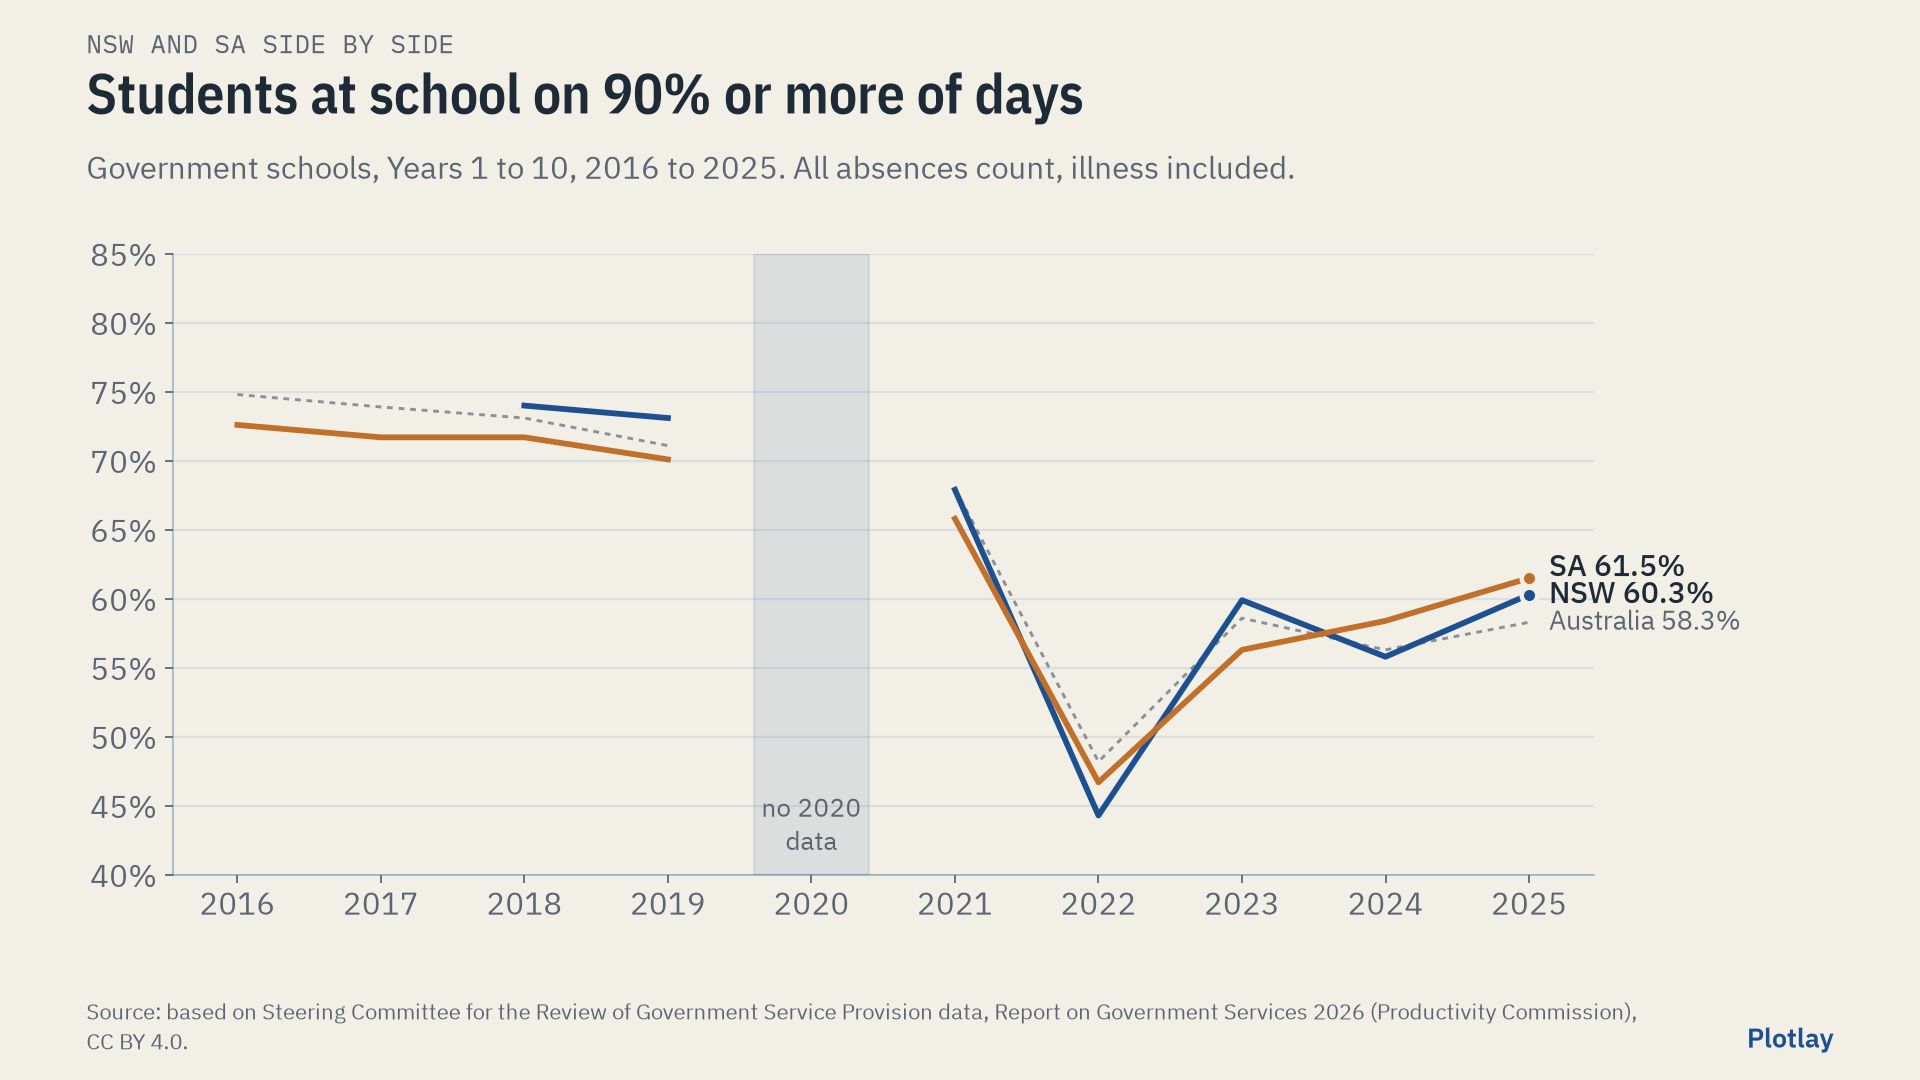
| At school 90% or more of days, Years 1 to 10, 2025 | 60.3% | 61.5% | +1.2 points |
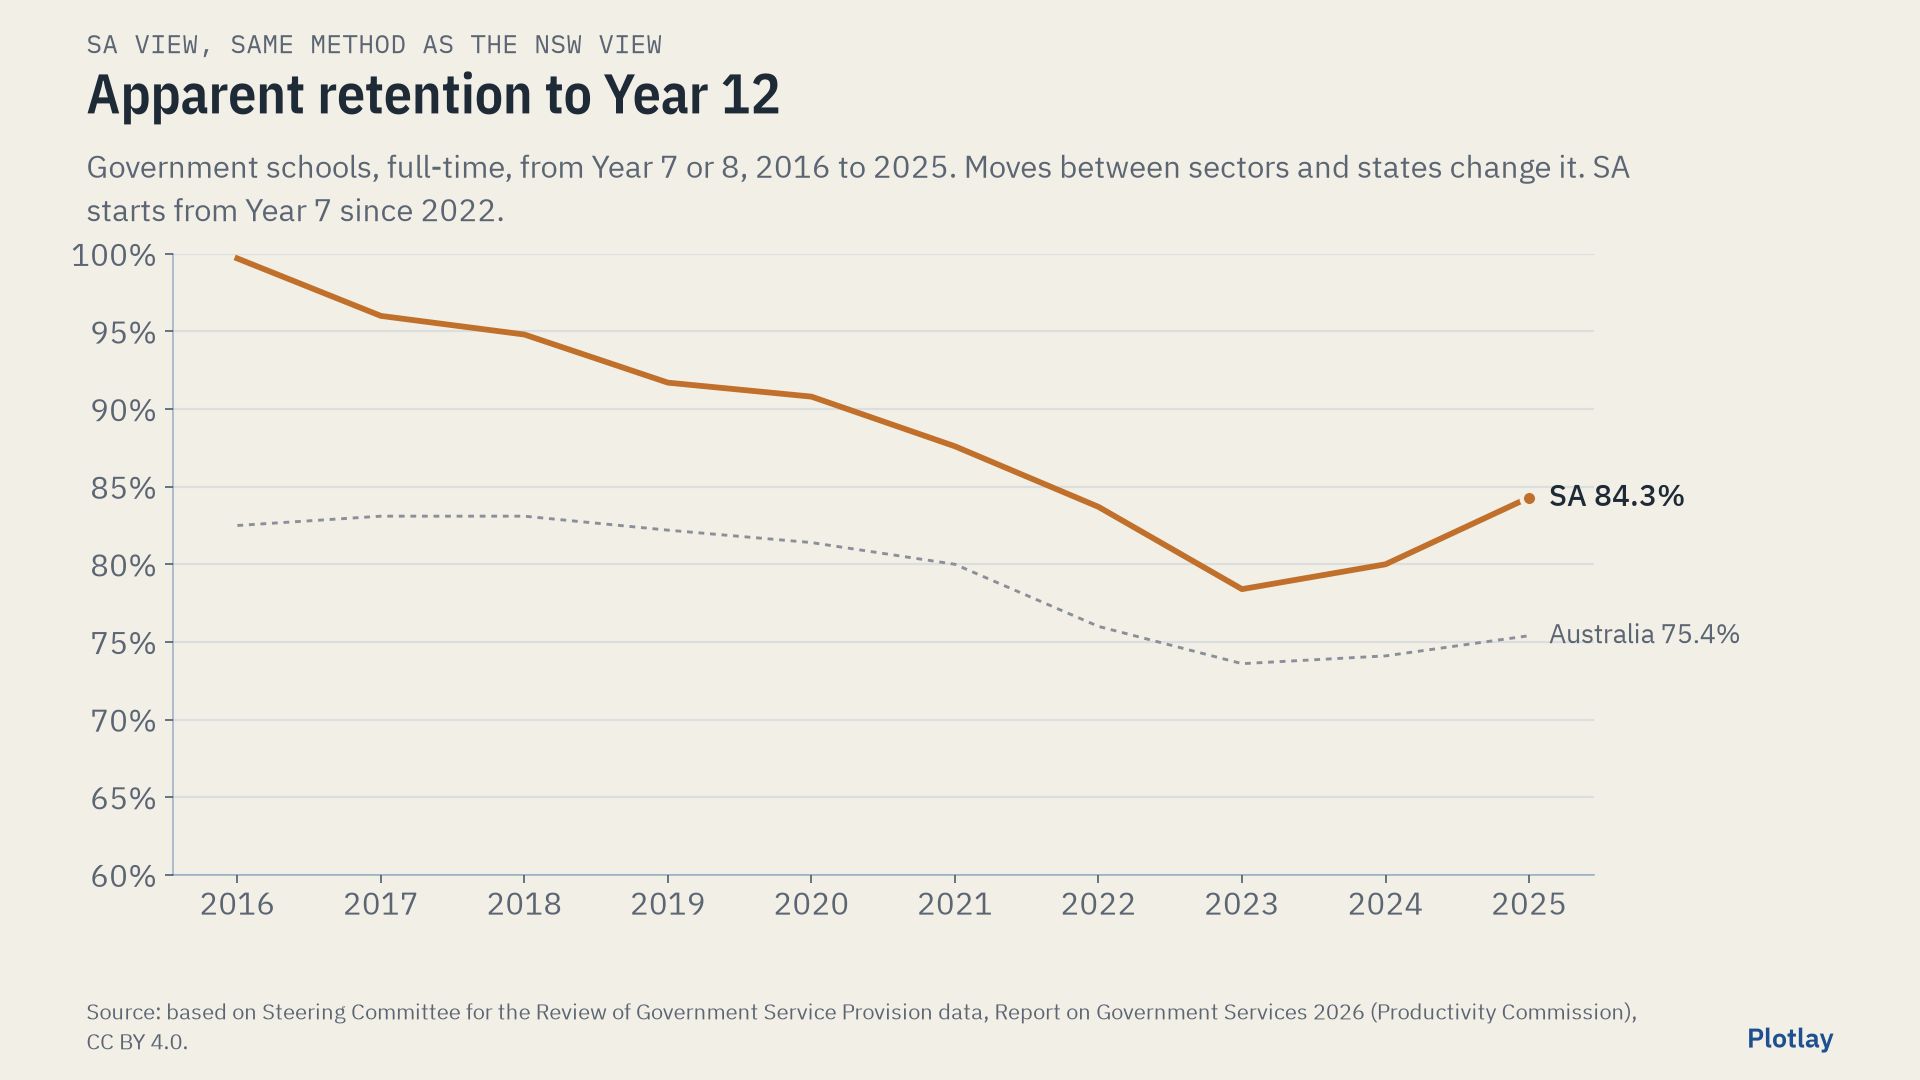
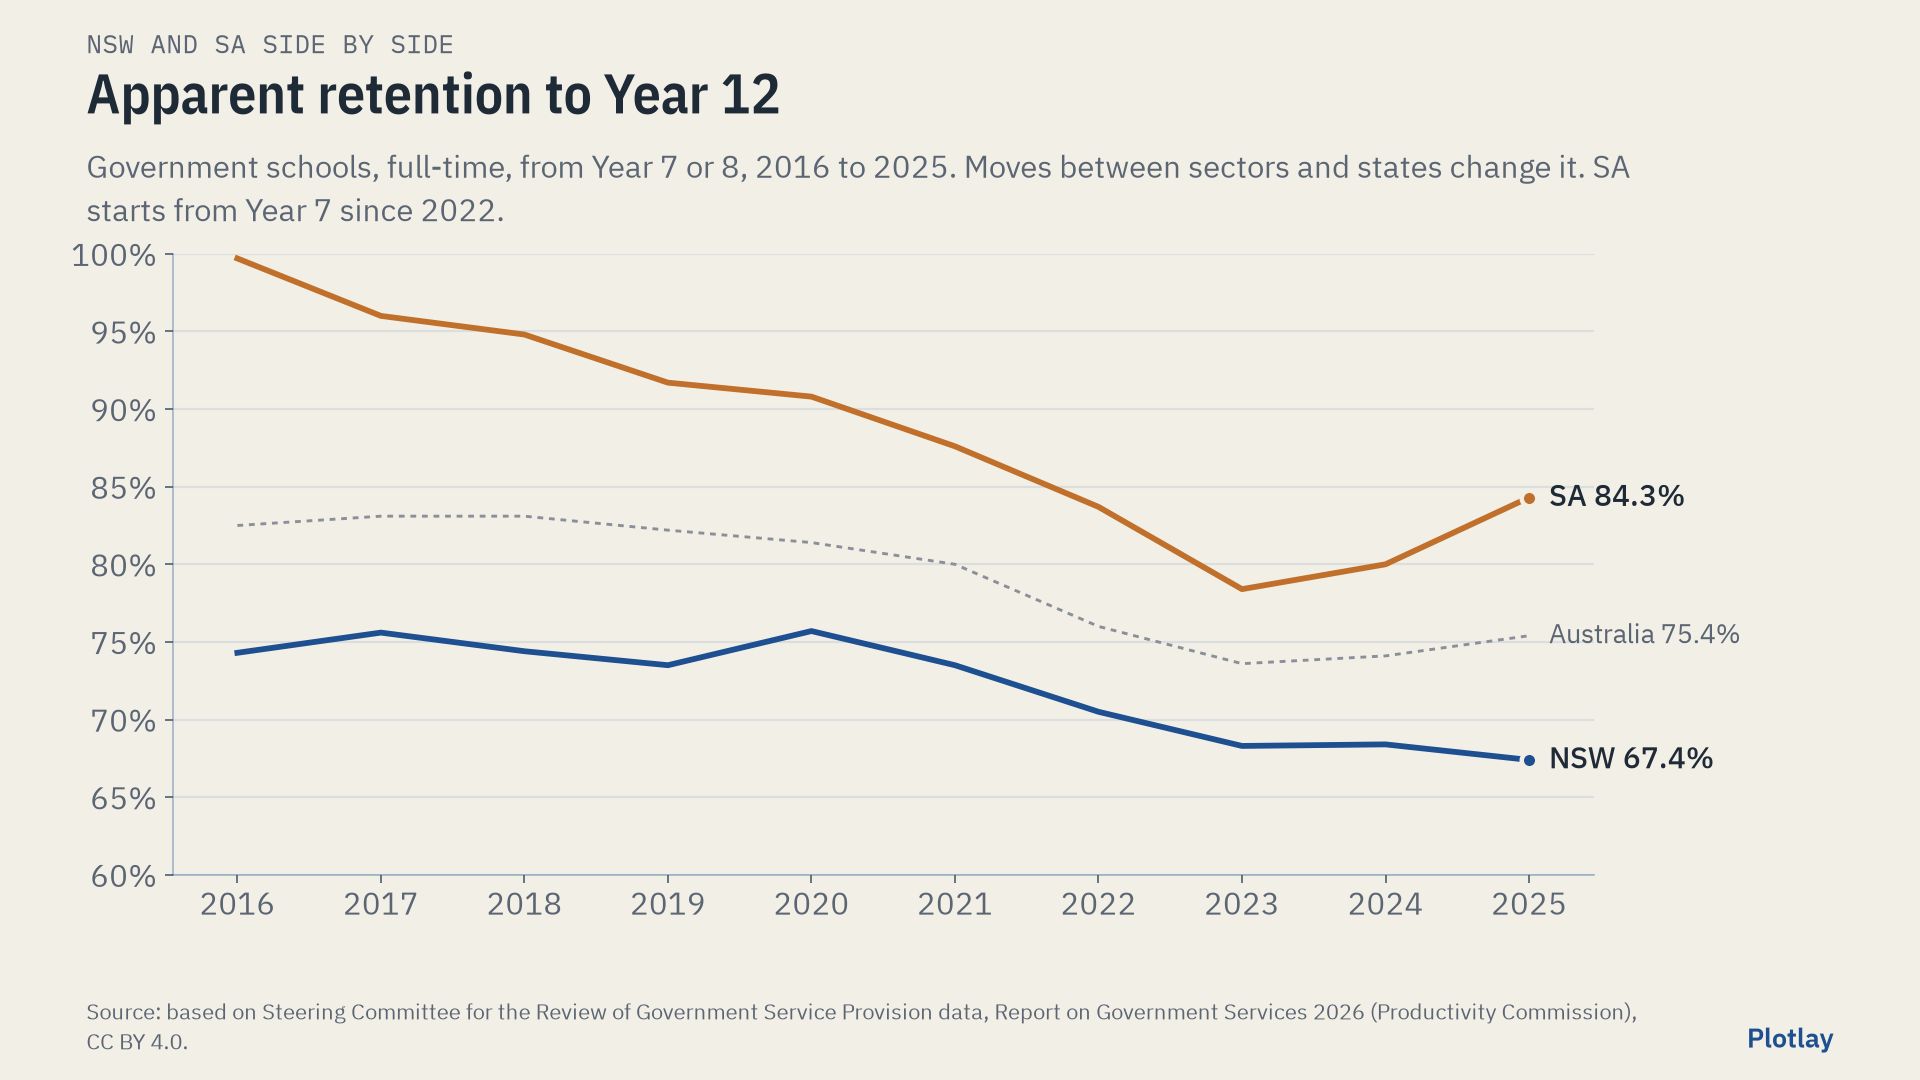
| Apparent retention to Year 12, 2025 | 67.4% | 84.3% | +16.9 points |
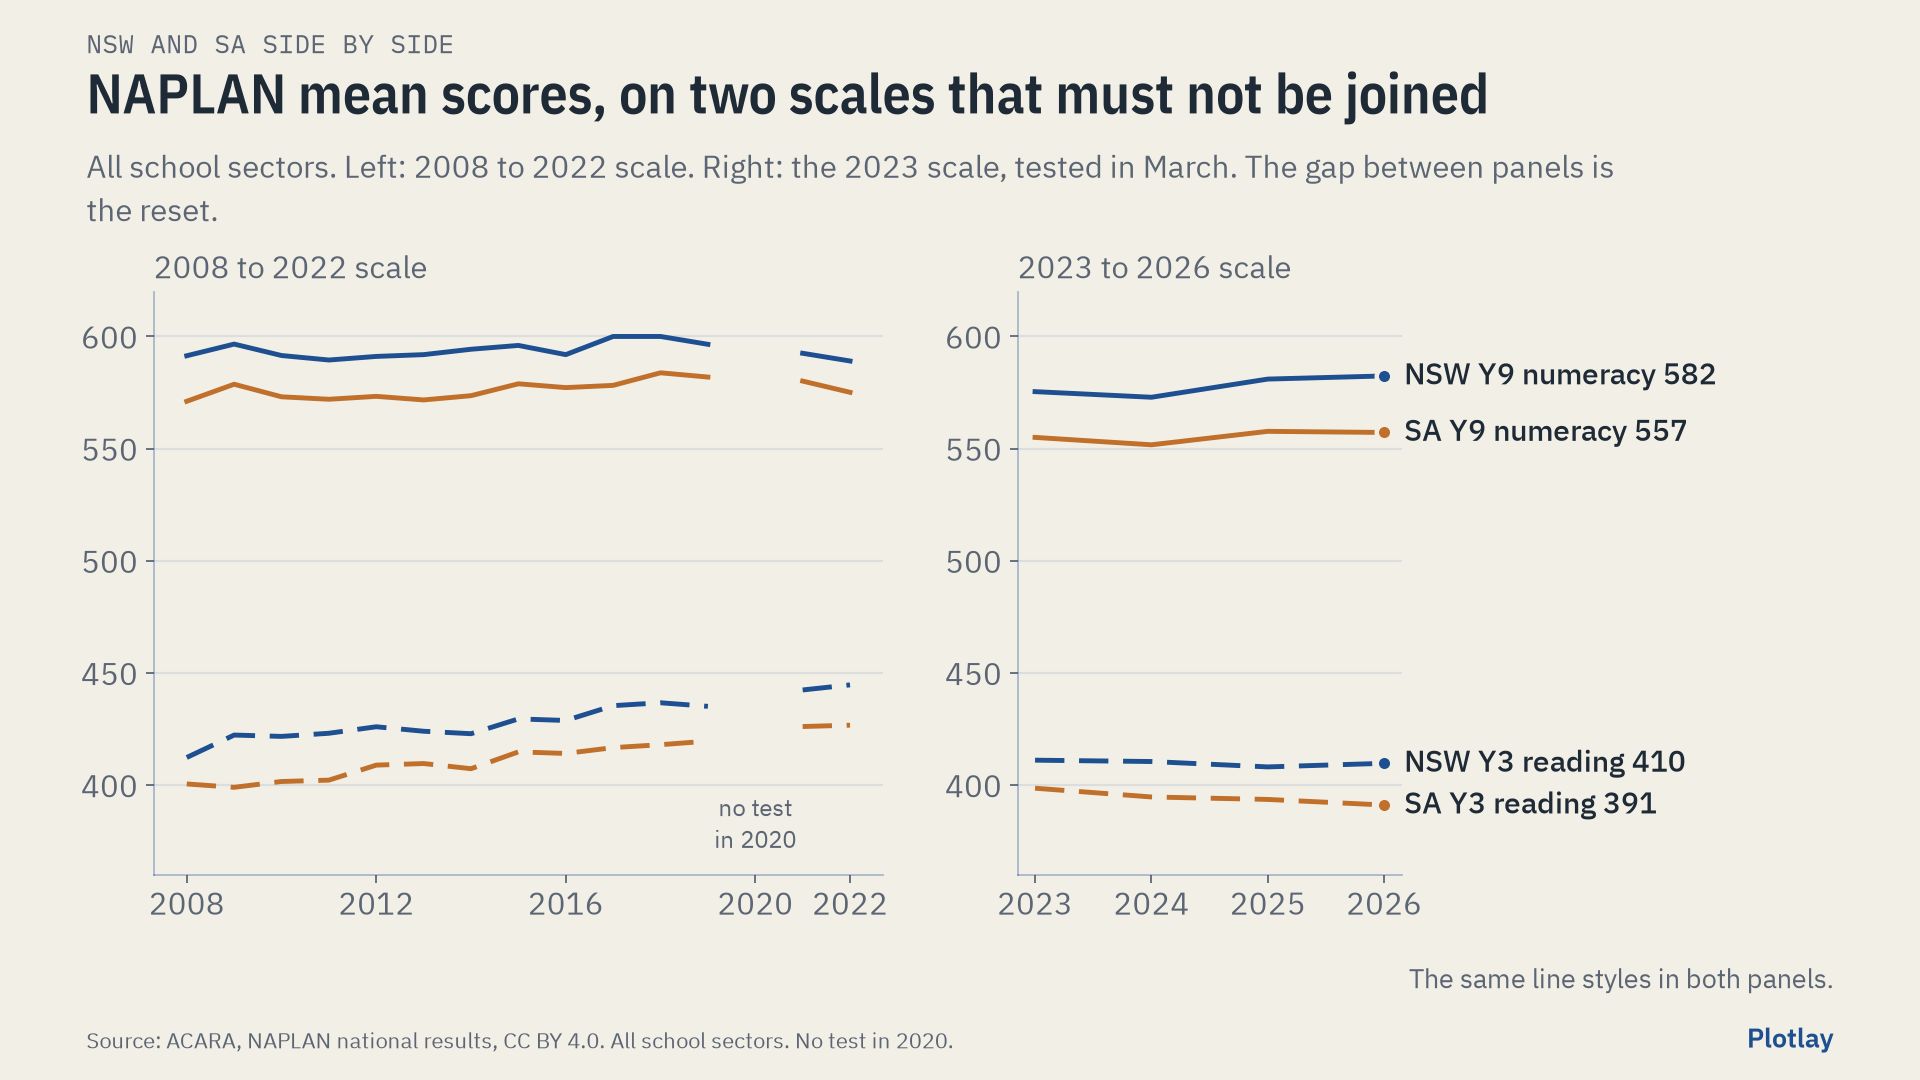
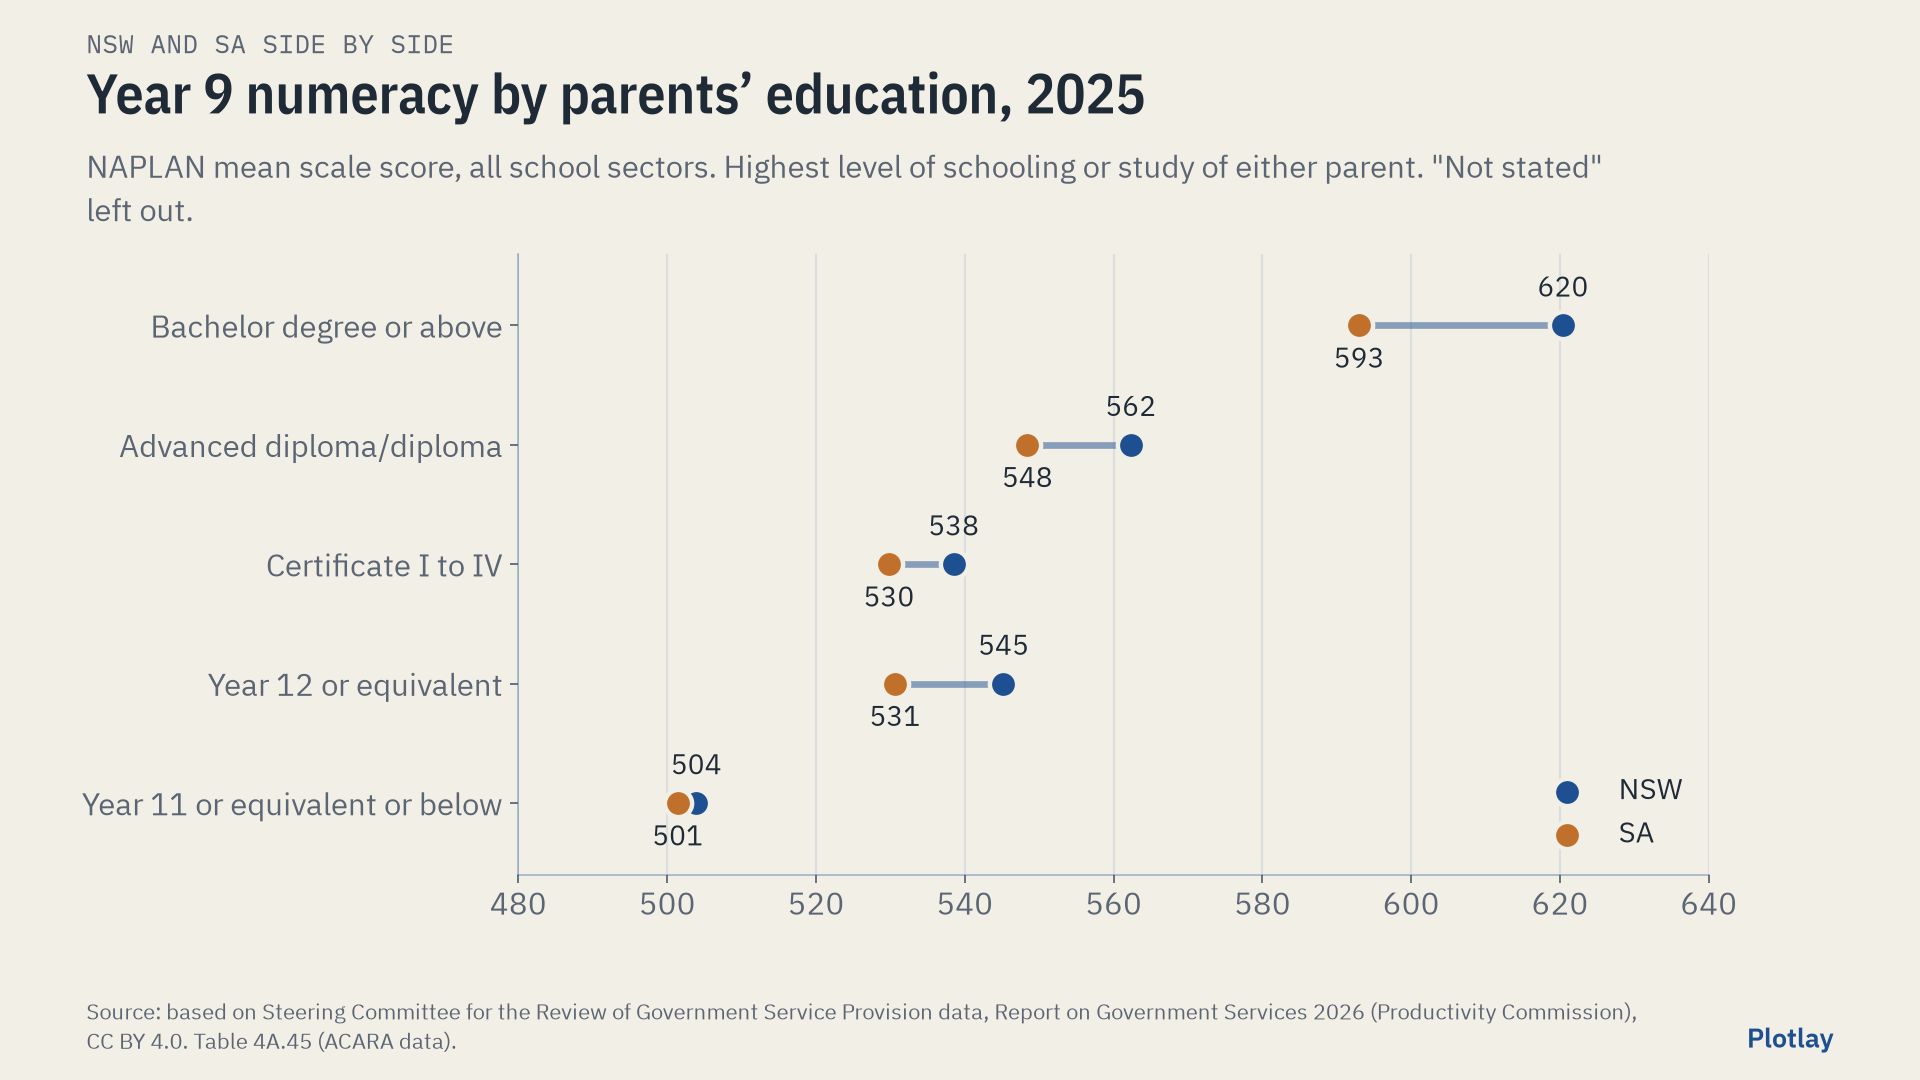
| NAPLAN Year 9 numeracy mean, all sectors, 2026 | 582.4 | 557.2 | -25.2 |
| Median grounds per student, primary, inner city 2024 | 28.1 m² | 42.4 m² | 1.51 times |
| Median grounds per student, secondary, inner city 2024 | 29.4 m² | 34.4 m² (44.0 with adjoining ovals) | 1.17 times |
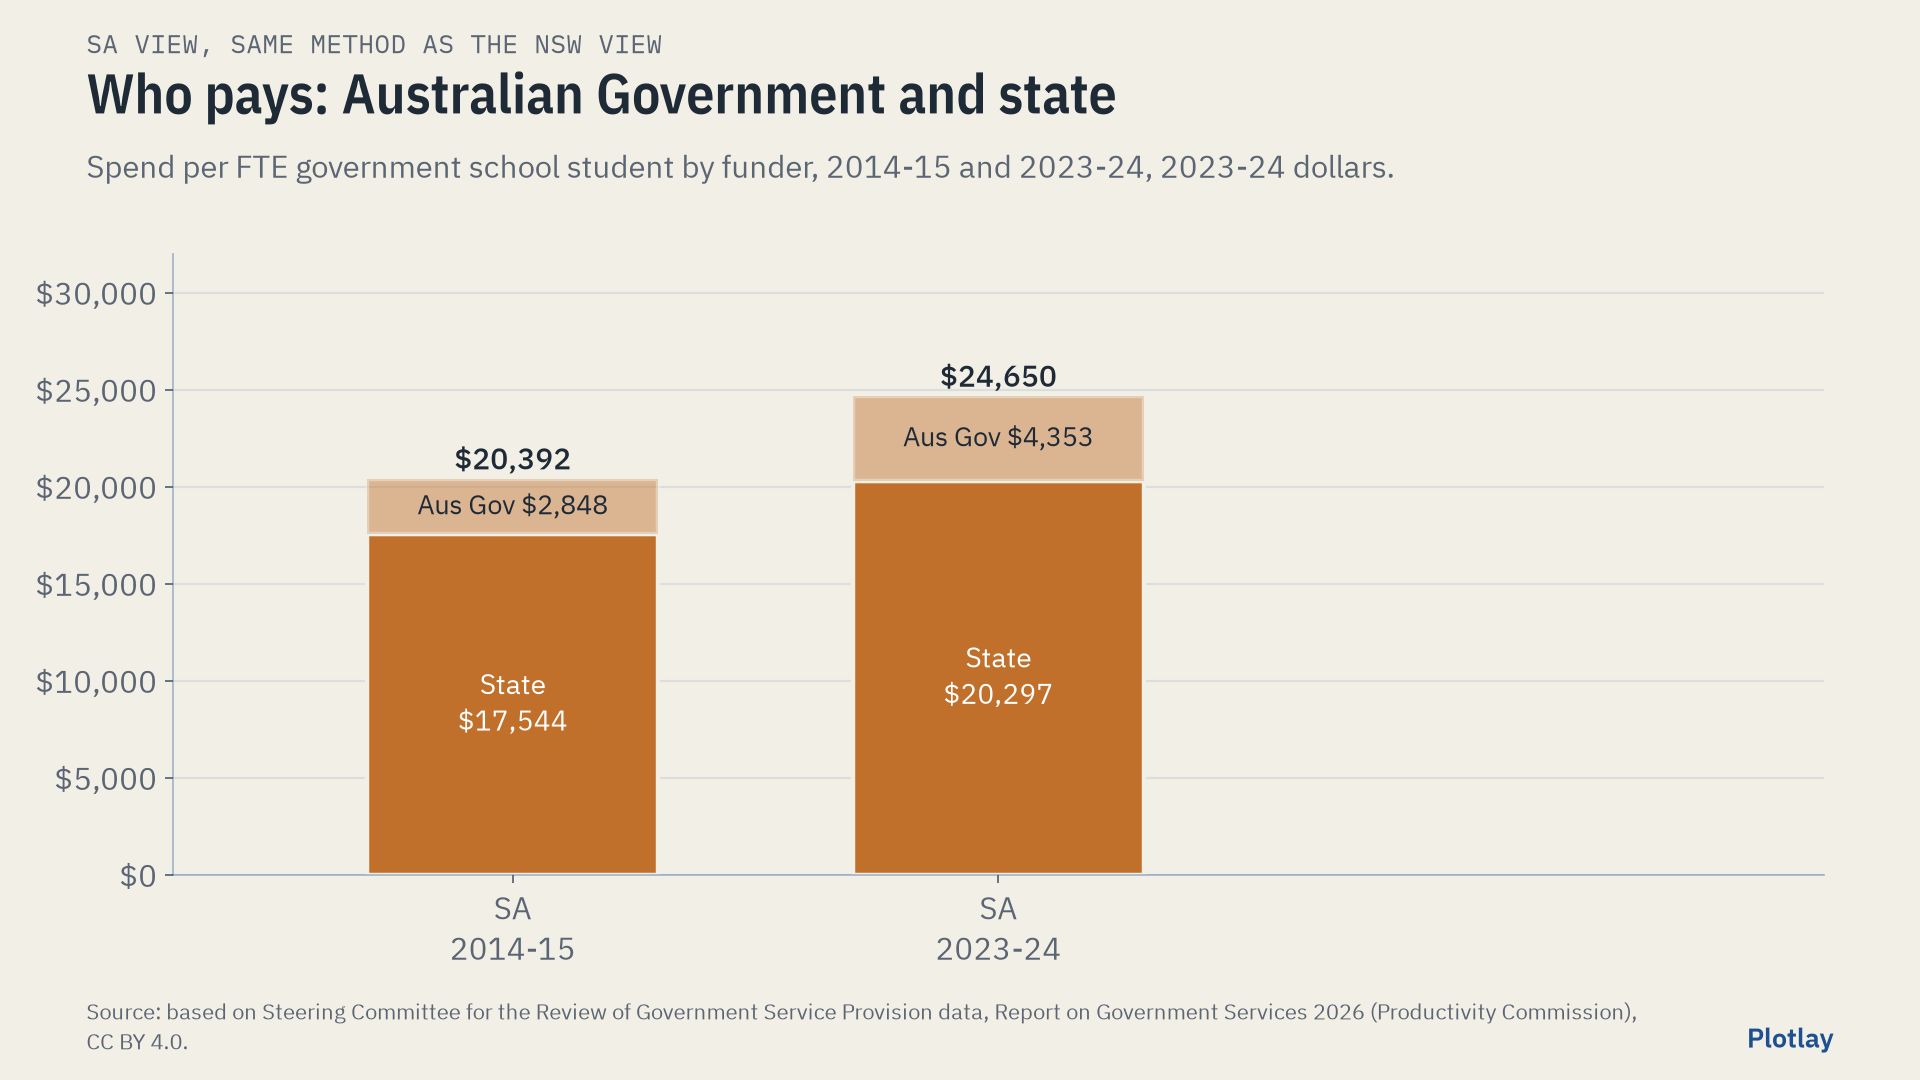
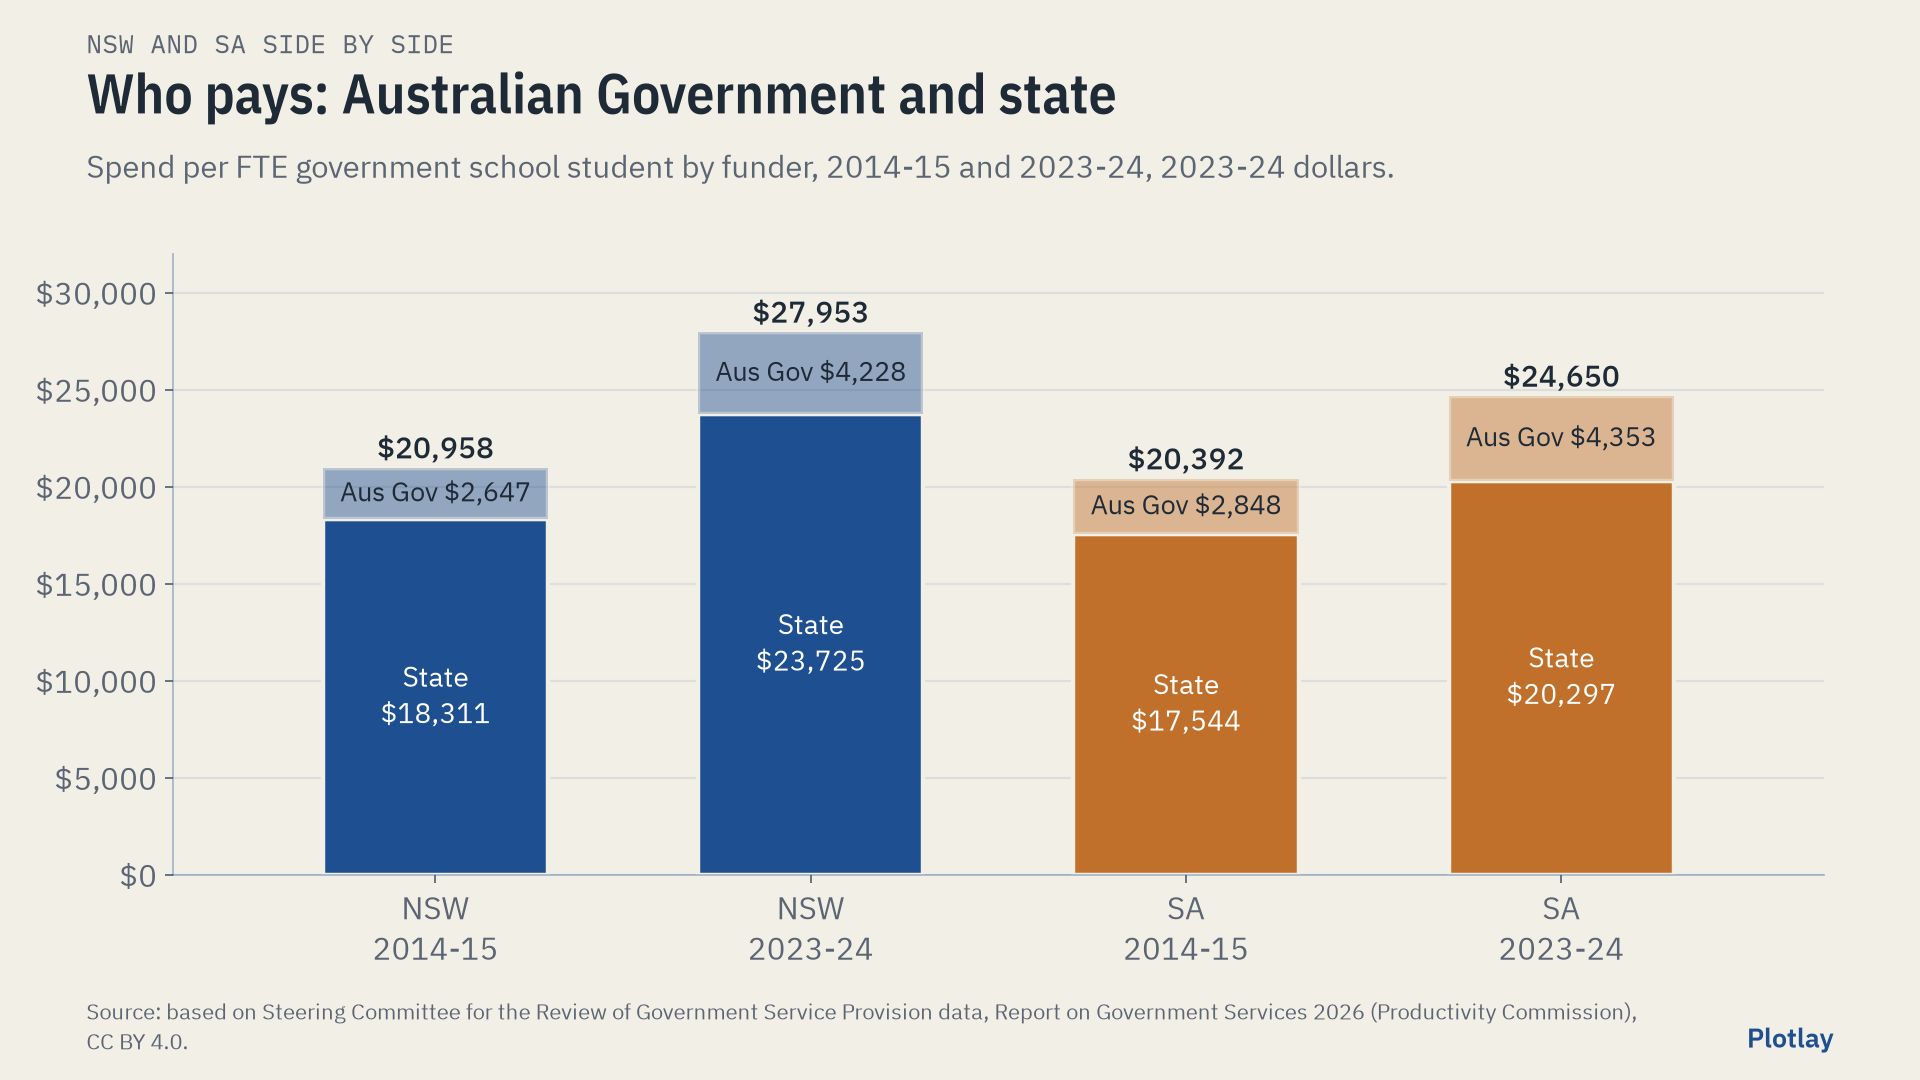
The two systems spent about the same per student in 2014-15; NSW’s real spend has grown faster since, most of the gap opening after 2021-22. NSW puts a larger share into teachers, SA a larger share into other staff, operating costs and out-of-school services. SA’s mean NAPLAN scores sit below NSW’s and its retention to Year 12 is higher. Inner Adelaide’s schools have about 1.5 times the grounds per primary student and 1.2 times per secondary student of inner Sydney’s (1.5 times per secondary student with the adjoining ovals). Inner Sydney is far denser, so this is what the same circle holds, not a measure of either system’s planning. None of these figures says why.
How it was made in Plotlay
One map project, two data layers, the same steps for each city:
- Inner Sydney: pick the lots. On the NSW aerial imagery, Land lots: a click asks NSW Spatial Services for the cadastre lot there, and the lots of one school join into one shape. 81 schools were made this way; 5 that share a lot with another school were drawn over the imagery.
- Inner Adelaide: build them from open land use data. SA’s cadastre and aerial imagery are not open. Pick from a layer, with the state’s SA Land Use Generalised 2025 file as the layer: a click takes the education polygon there, with its fields and its licence (51 schools). Gilles Street Primary came from the City of Adelaide parcels that name it; Unley High from a cut drawn on the state’s 0.5 m land cover rasters.
- Key each shape by its school code, and link the tables: one row per school, and enrolments by year. Every code matched in both cities.
- Colour by m² per value (the area divided by the students) on the same breaks set by hand in both layers: 15, 30 and 60 m². The time slider steps from 2015 to 2024 and moves both cities.
- Export GeoJSON, TopoJSON for the Power BI Shape Map, CSV with WKT, the joined data and a Python starter.
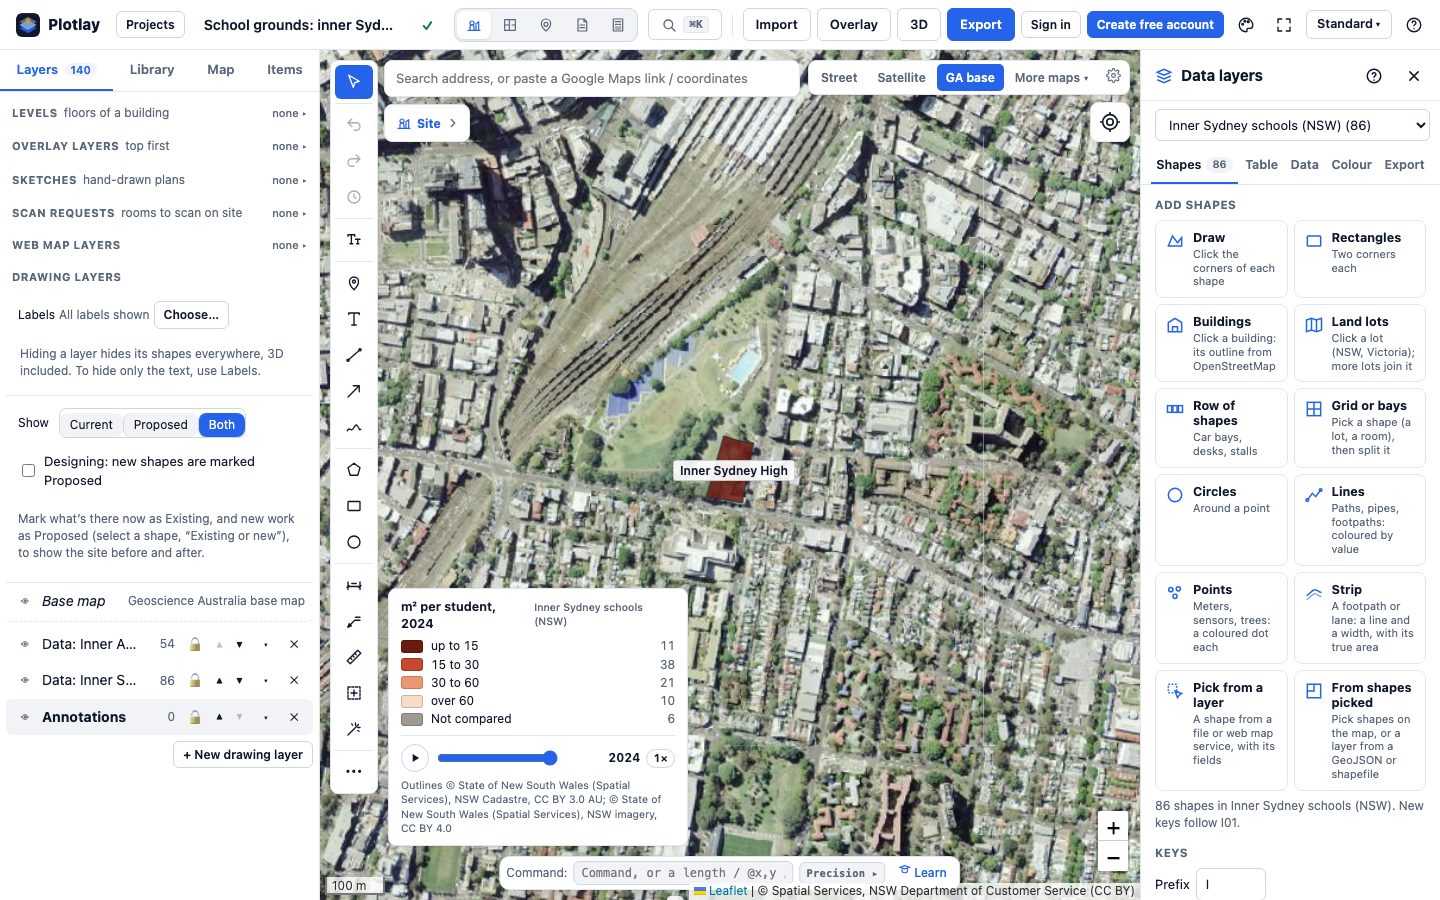
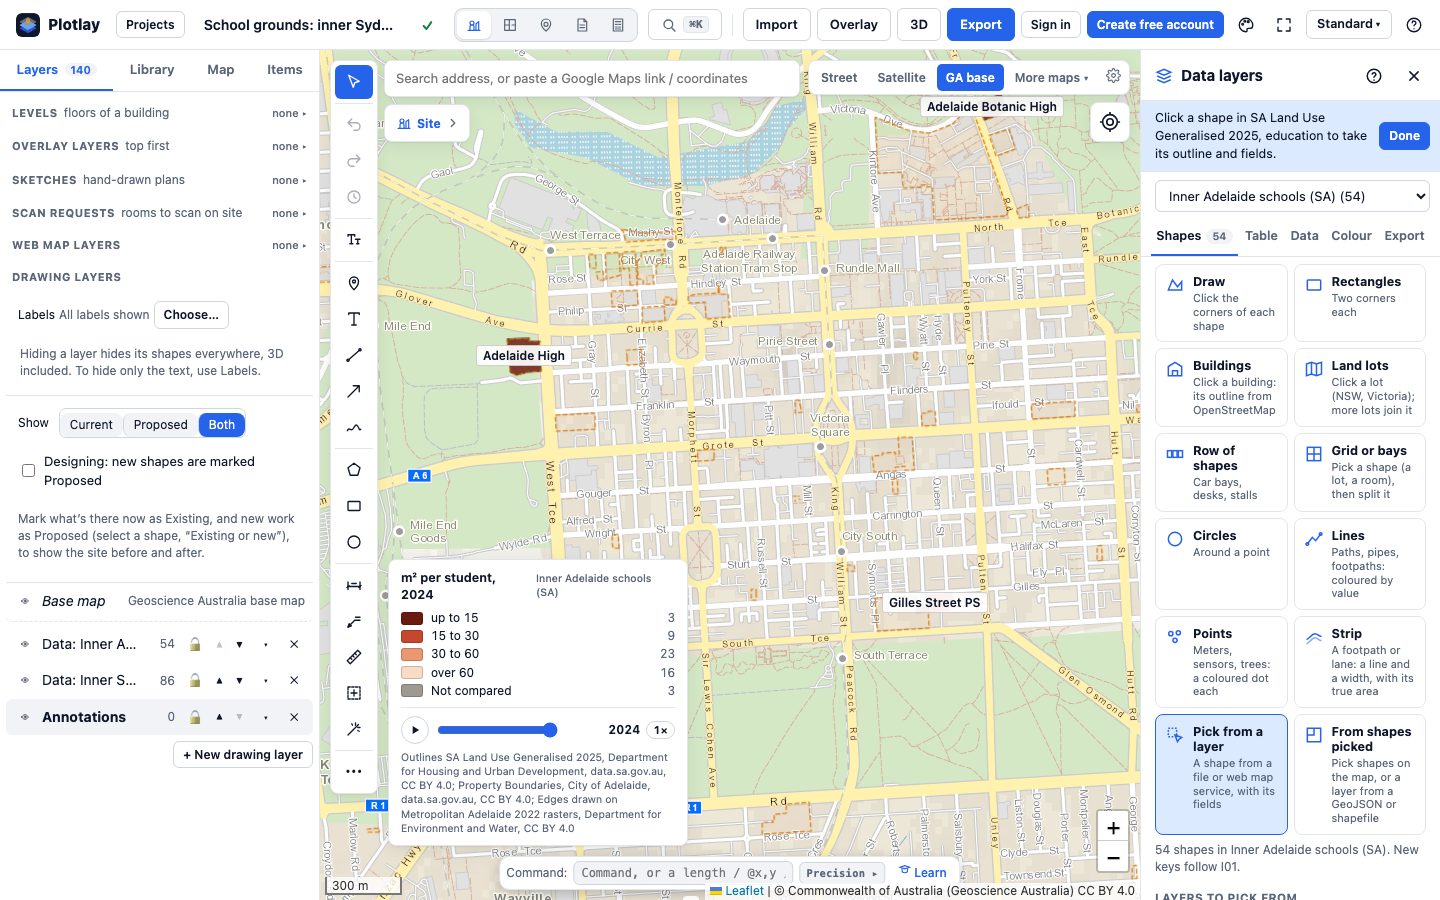
Every outline has a grade, on one scale for both cities: A (the school’s own parcels), B (an open question, named), C (a parcel split along an edge drawn on open 0.5 m imagery) or D (not an outline of the school’s own grounds: shared with another school or a campus that is not the school, or a school split across two sites). D is left out of every median: 6 in Sydney, 1 in Adelaide. Nothing here comes from OpenStreetMap.
The Sydney schools showcase (grounds per student across 81 inner Sydney and Parramatta schools, 2025 headcount; its medians differ from this page’s 86 schools within 7 km and 2024 students) · More about Data layers · Make a data layer of your own
Power BI


The same shapes and tables as a Power BI Project (.pbip) with three pages: NSW, SA and NSW and SA, a year slicer on each page and a state slicer on the side-by-side page, the Shape Map from the TopoJSON, the DAX measures and the Plotlay theme. It reads the data straight from the public repository, so it refreshes with no gateway.
The Power BI project is in the plotlay-schools-nsw-sa repository on GitHub, with steps to open it in Power BI Desktop.
Python
An executed Jupyter notebook in three sections, one per view. The NSW and SA sections run the same functions with only the state changed; the third puts them side by side. It recomputes every number on this page from the data, with checks that fail if a shape or a table changes.
Download the notebook (with its outputs) and the data. Both are also in the plotlay-schools-nsw-sa repository on GitHub.
Read it carefully
- Headcount against FTE. NSW counts headcount (August), SA counts full-time equivalent students (Term 3). FTE is at most the headcount, so SA’s m² per student would be a little lower on a headcount basis.
- Staged openings. A school without all its year groups in 2024 is left out of the medians in both cities. Inner Sydney High opened in 2020 with Year 7 and added a year group each year; 2025 is its first year with Years 7 to 12. Adelaide Botanic High had all its year groups from 2022.
- The Year 7 move. SA moved Year 7 from primary to high school in 2022; NSW has had Year 7 in high school throughout. SA series that cross 2022 change meaning, and SA’s secondary numbers jump that year. In 2024 both states’ primary and secondary groups line up.
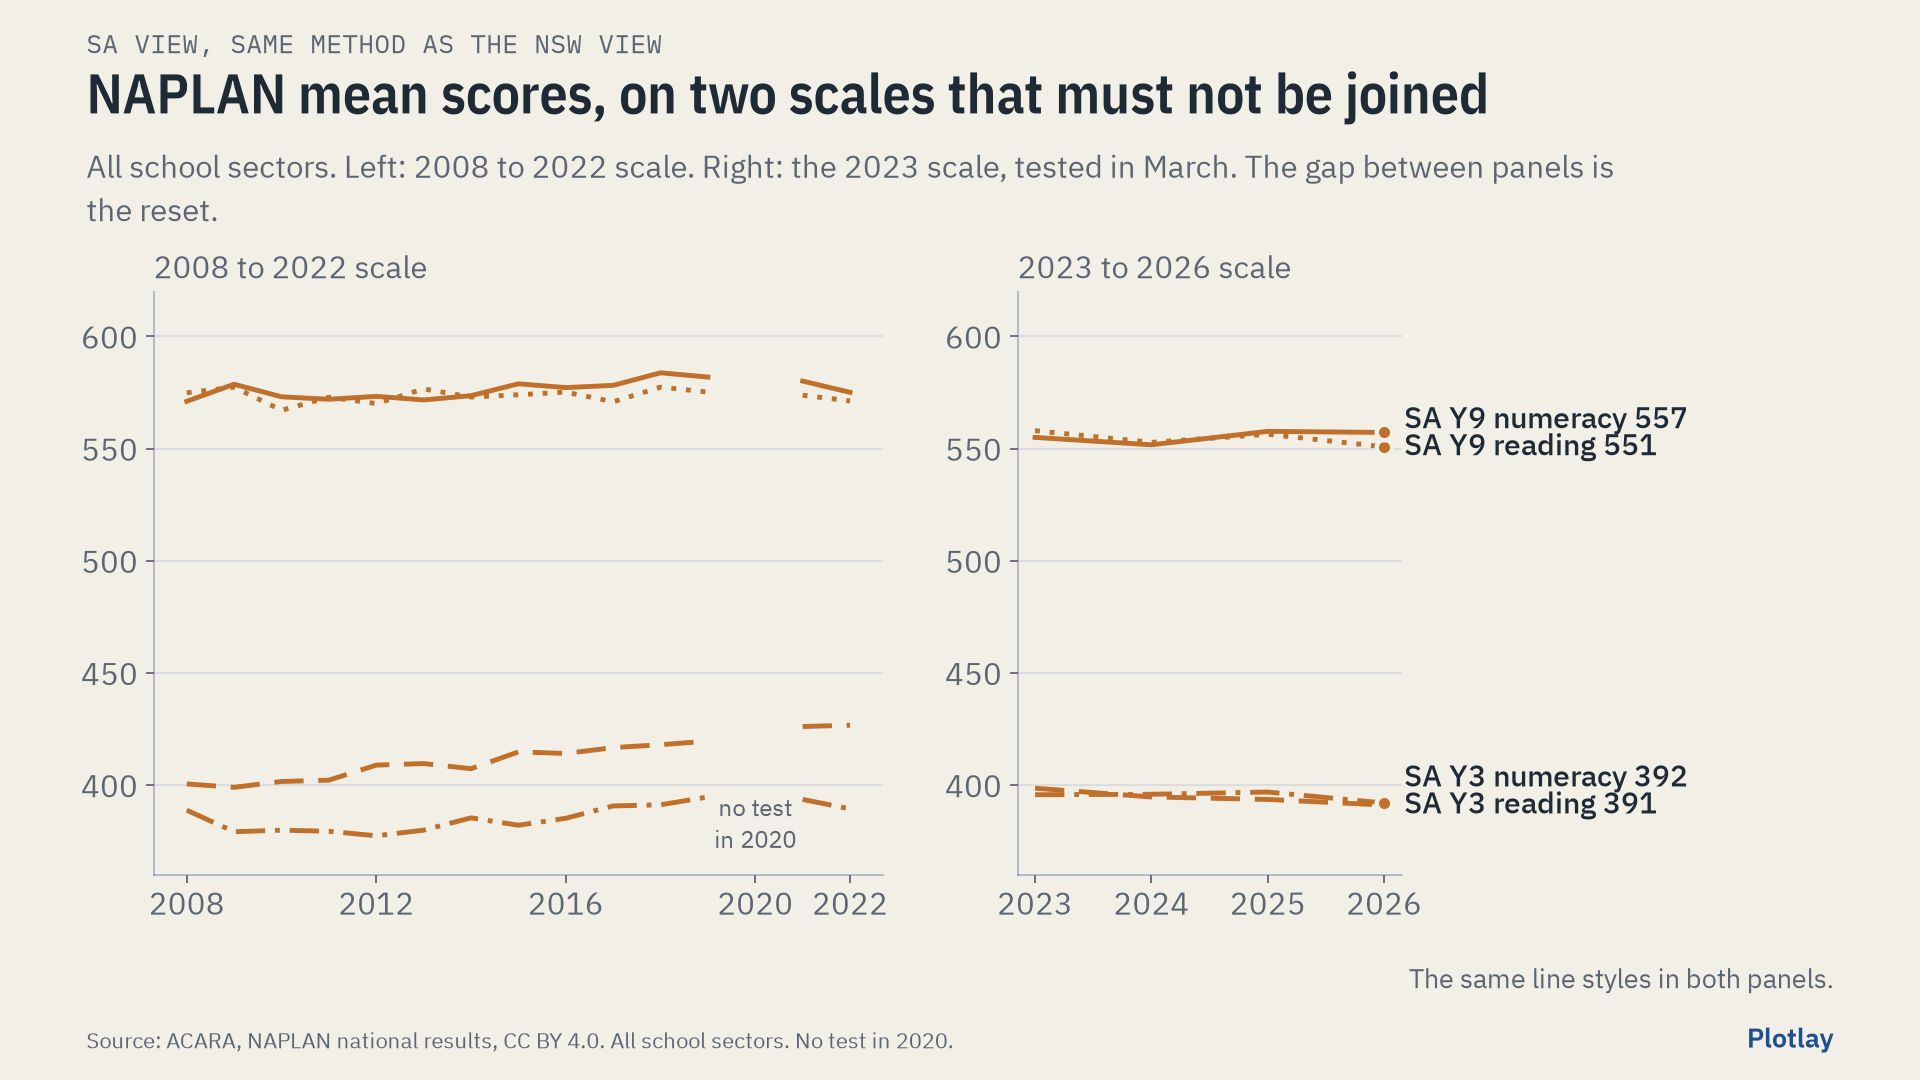
- NAPLAN by state is all sectors, not government schools alone, and the scale was reset in 2023: the two eras are never joined.
- Grounds are land, buildings included: not floor space and not playground area. A separate lot or recreation parcel next to a school is not counted in either city. Areas are approximate: accuracy depends on the cadastre, parcels and imagery the outlines came from. Areas are measured on GDA2020 Australian Albers (EPSG:9473), an equal-area grid.
- Money is reported spending, not need. States classify some staff and services differently; asset values reflect age, valuation method and land prices.
- The mix differs. SA government schools have more students with low socio-educational advantage (34.5% against 31.6%), more remote students (4.0% against 0.4%) and more students with a disability adjustment (30.3% against 27.2%, all schools).
The other schools showcases
This page uses the 86 government schools within 7 km of Sydney Town Hall and 2024 students (NSW August headcount, SA Term 3 FTE). The Sydney schools showcase uses 81 schools across inner Sydney and Parramatta and 2025 headcount, so its medians differ.
- Sydney schools: grounds per student across 81 inner Sydney and Parramatta government schools (2025 headcount), with the two vertical schools left out of the comparison.
- Inner Sydney High, a deep dive: the 14-storey vertical school, measured by its estimated floor space per student over its staged opening.
- One school campus, building by building: University High in Parkville drawn as its buildings and rolled up to the site, with estimated floor space.
Sources and licences
School spending, staffing, assets, attendance and retention: based on Steering Committee for the Review of Government Service Provision data, Report on Government Services 2026 (Productivity Commission), licensed under CC BY 4.0. NAPLAN results: Australian Curriculum, Assessment and Reporting Authority (ACARA), CC BY 4.0. Budgets: NSW Treasury, Government of South Australia, State of Victoria (Department of Treasury and Finance), Australian Government Department of Education and National School Resourcing Board, each CC BY 4.0.
School data: NSW Department of Education (data.nsw.gov.au, CC BY), including ICSEA in the master dataset and RAM funding by school; Department for Education, Government of South Australia (data.sa.gov.au, CC BY 4.0). Changes: reshaped to one row per school per year; renamed SA schools joined by school number.
Outlines: NSW Cadastre and NSW Imagery, © State of New South Wales (Spatial Services), licensed under CC BY 3.0 AU. SA Land Use Generalised 2025, Department for Housing and Urban Development, CC BY. Property Boundaries, City of Adelaide, CC BY 4.0. Metropolitan Adelaide 2022 green space and building rasters, Department for Environment and Water, CC BY 4.0. Outlines made in Plotlay.
Staged openings: Inner Sydney High School and School Infrastructure NSW (opened 2020 with Year 7, Years 7 to 12 from 2025); Adelaide Botanic High School annual report (Years 7 to 12) and SA House of Assembly Hansard, 19 March 2019 (opened 2019 with Years 8 and 9).
Our outlines, tables and charts are CC BY 4.0 and the code is MIT: see the licence files in the data download and the plotlay-schools-nsw-sa repository on GitHub. Maps: Leaflet. Independent work using open data, not endorsed by any of these agencies.
Make shapes for your own data
Plotlay is free to start: every tool, three cloud projects.
Create free accountThen open Data layers in any map project