
Showcase · Data layers · Walking catchments
A drink within five minutes
How much of each city’s centre is within a 5-minute walk of a public drinking fountain? Seven city centres, the same size each: everything within 1.5 km of the city hall, measured along the streets, not as the crow flies.
A 5-minute walk is 400 m at an easy 4.8 km/h. In Rome 98.6% of the street length in the centre is that close to a fountain, in Melbourne 97.6% and in Barcelona 96.8%. Paris has 94.9%, New York 88.0% and Sydney 85.7%. San Francisco has 50.1%: half its central streets are more than 5 minutes from a fountain in the city’s list. Cut the walk to 2 minutes (160 m) and the cities spread out: Barcelona 73.5%, Rome 71.3%, Melbourne 48.9%, down to San Francisco at 8.7%.

Seven cities, seven ways of counting
Each city publishes its fountains differently, or not at all. Melbourne lists every unit, with bottle refill taps and dog bowls as their own records. Sydney lists the council’s own fountains, not those in the state’s precincts such as Darling Harbour and Barangaroo. New York’s list is the Parks department’s, so it holds only the fountains on Parks property, 543 of them indoors. San Francisco’s table mixes fountains with public toilets and library fountains. Paris’s list is under a share-alike licence, and Rome publishes its nasoni on a map service with no open licence. None of them says what share of the city is within reach of one.
So the fountains here follow one rule in every city: outdoor public drinking fountains and bottle refill points, leaving out indoor units, sinks, dog bowls and anything marked out of service or outside the city. Where a city has no openly licensed list (Rome), OpenStreetMap’s drinking water points stand in. Then the same tool measures every city the same way.
The map
Pick a city. Districts colours each district by the share of its street length within a 5-minute walk of a fountain. Streets shows the streets themselves: blue within 400 m of a fountain along the streets, orange further, with each fountain a dot. Hover over a district, or tap it on a phone, for its numbers.
The seven centres
| City | Streets within 5 min | Within 2 min | Residents within 5 min | Fountains | Per km² | Street km |
|---|---|---|---|---|---|---|
| Rome | 98.6% | 71.3% | 99.7% | 210 | 30 | 147.2 |
| Melbourne | 97.6% | 48.9% | 99.5% | 122 | 18 | 153.2 |
| Barcelona | 96.8% | 73.5% | 98.8% | 180 | 28.1 | 146.8 |
| Paris | 94.9% | 37.7% | 95.8% | 103 | 14.6 | 149.4 |
| New York | 88.0% | 34.0% | 92.6% | 95 | 18.9 | 93.6 |
| Sydney | 85.7% | 32.5% | 89.5% | 84 | 12.7 | 131 |
| San Francisco | 50.1% | 8.7% | 62.4% | 26 | 3.7 | 146.6 |
Rome and Barcelona have the most fountains for their size: 30 and 28.1 a km², against 3.7 in San Francisco. Melbourne’s 122 are spread evenly through the grid, so 97.6% of its streets are within 5 minutes even with fewer than Barcelona. San Francisco’s 26 fountains are mostly Recreation and Parks fountains; the Mission part of the study area, with 1 fountain, has 27.8% of its streets in reach.
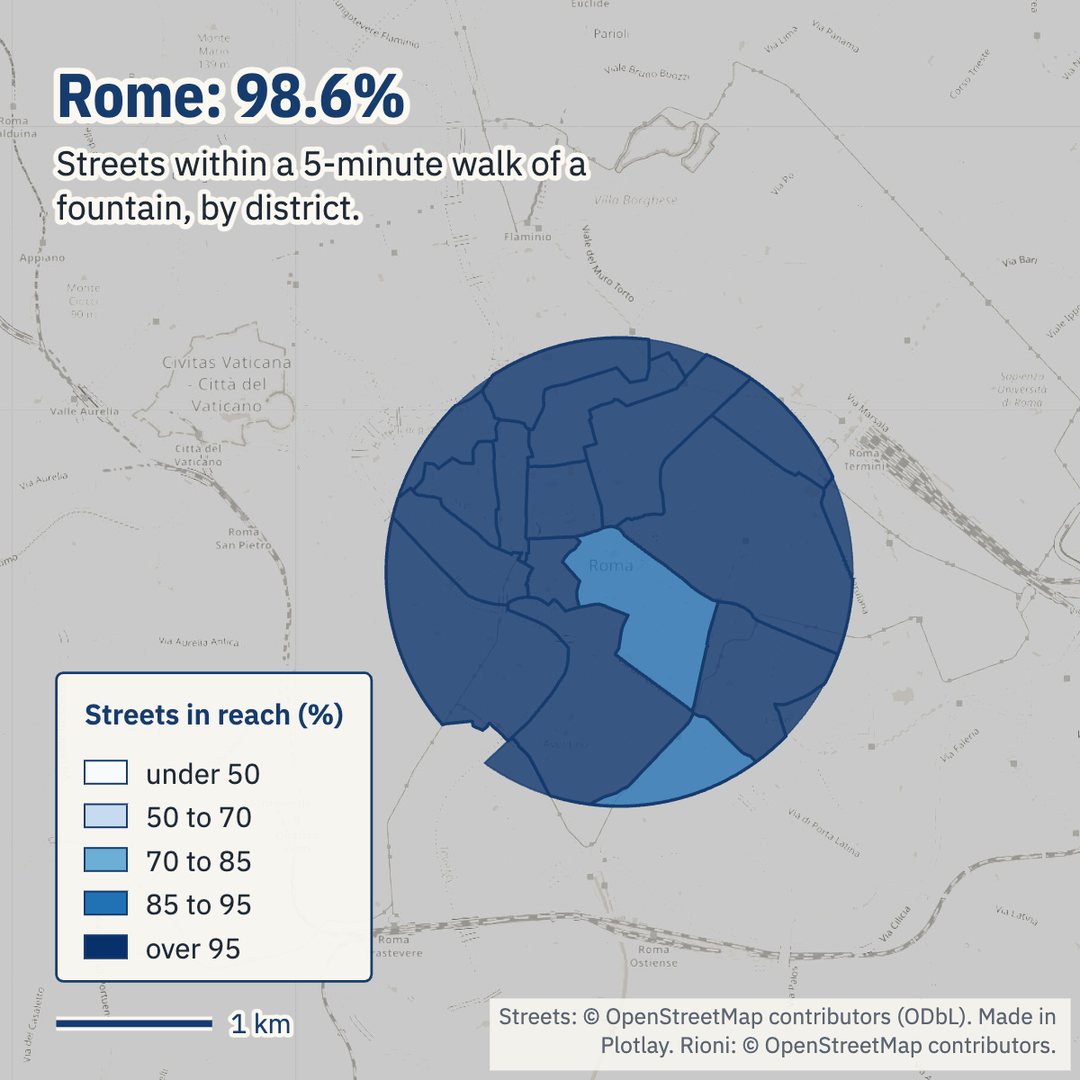
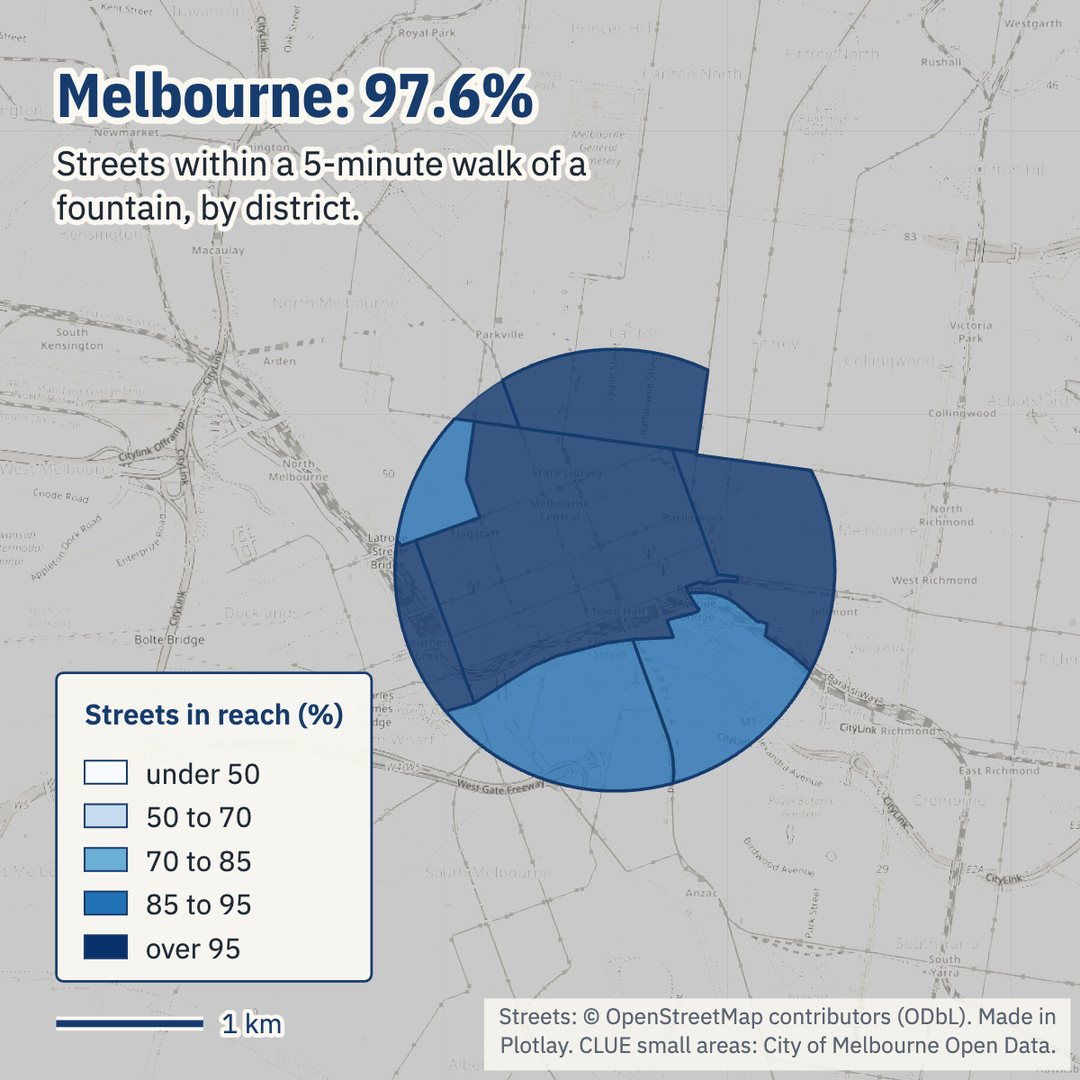
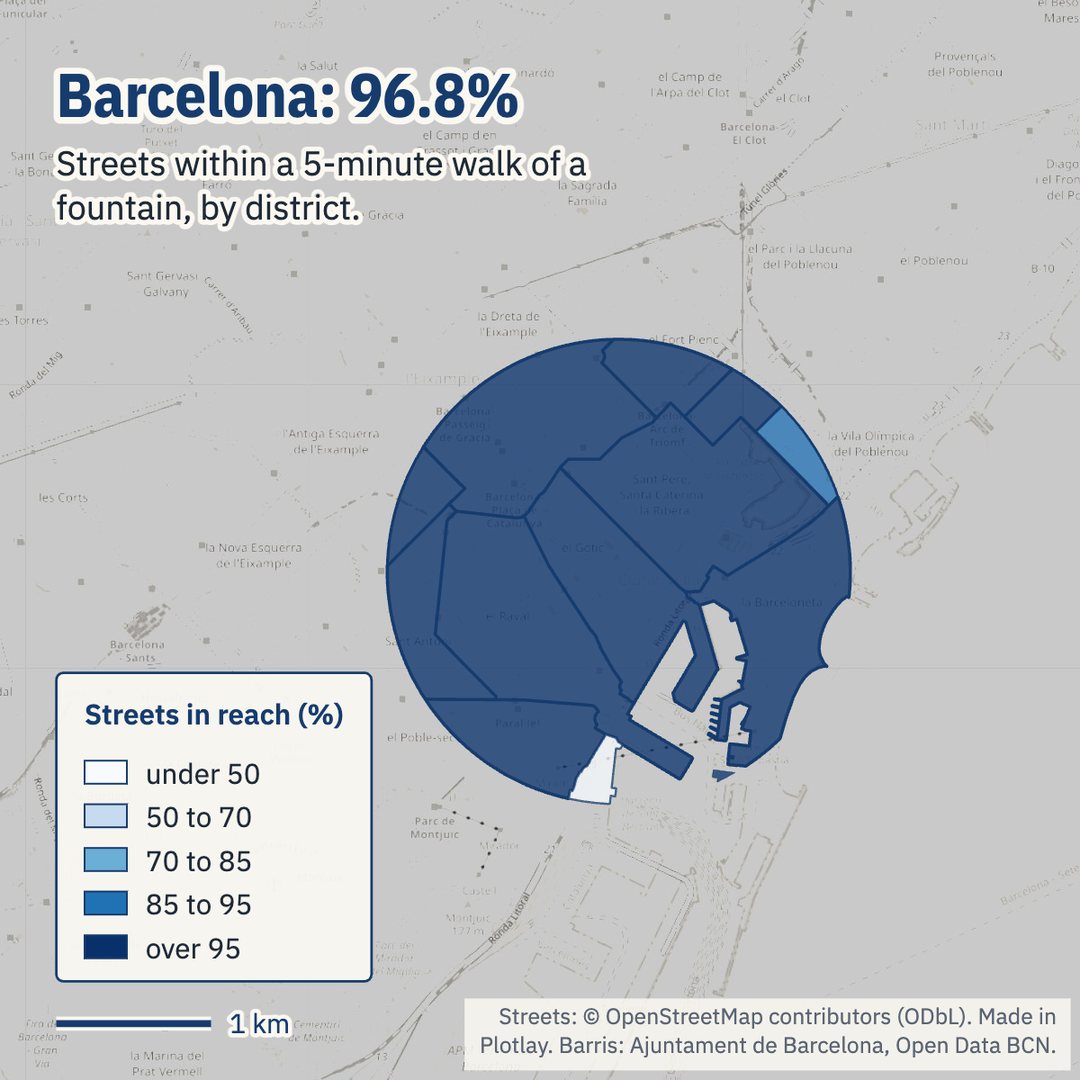
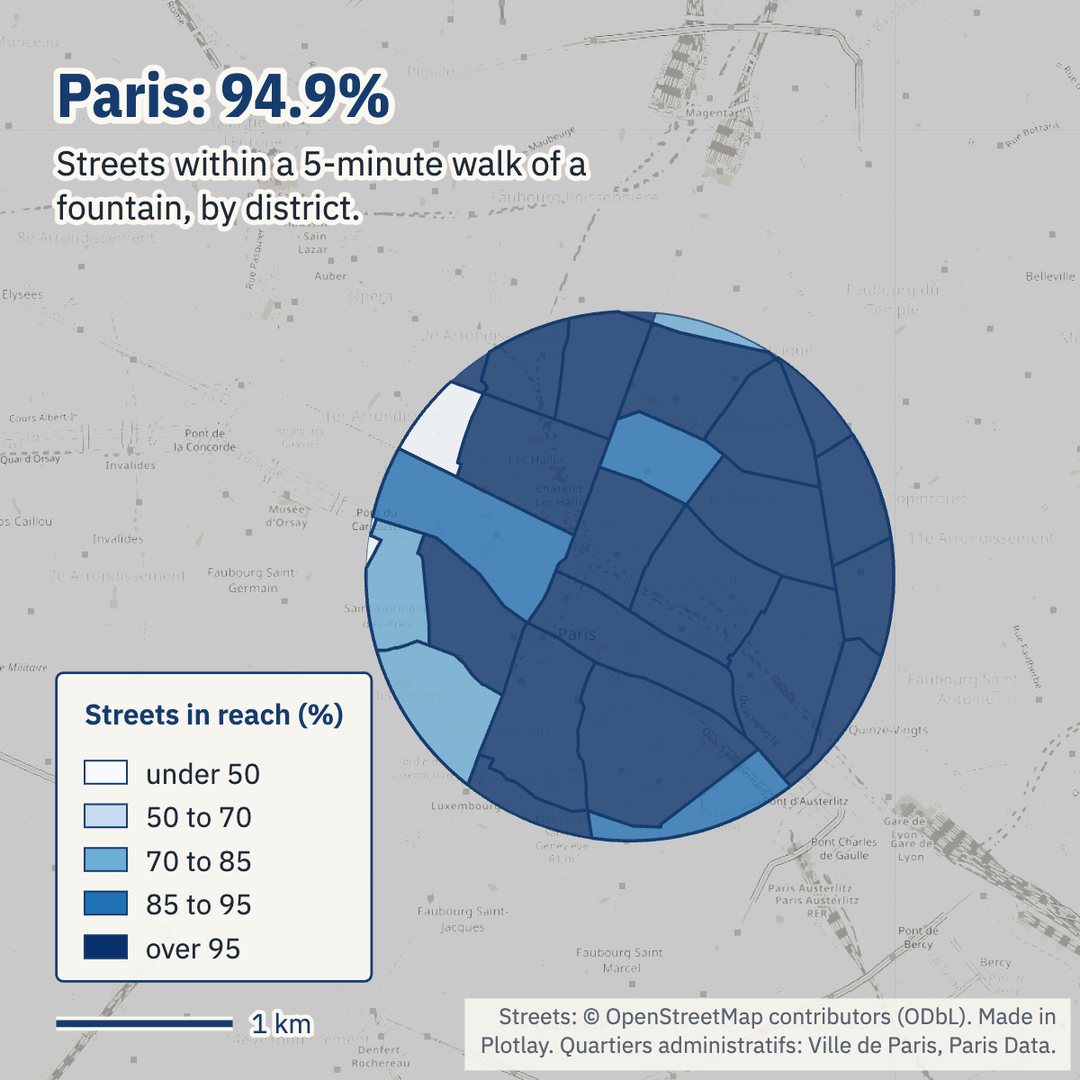
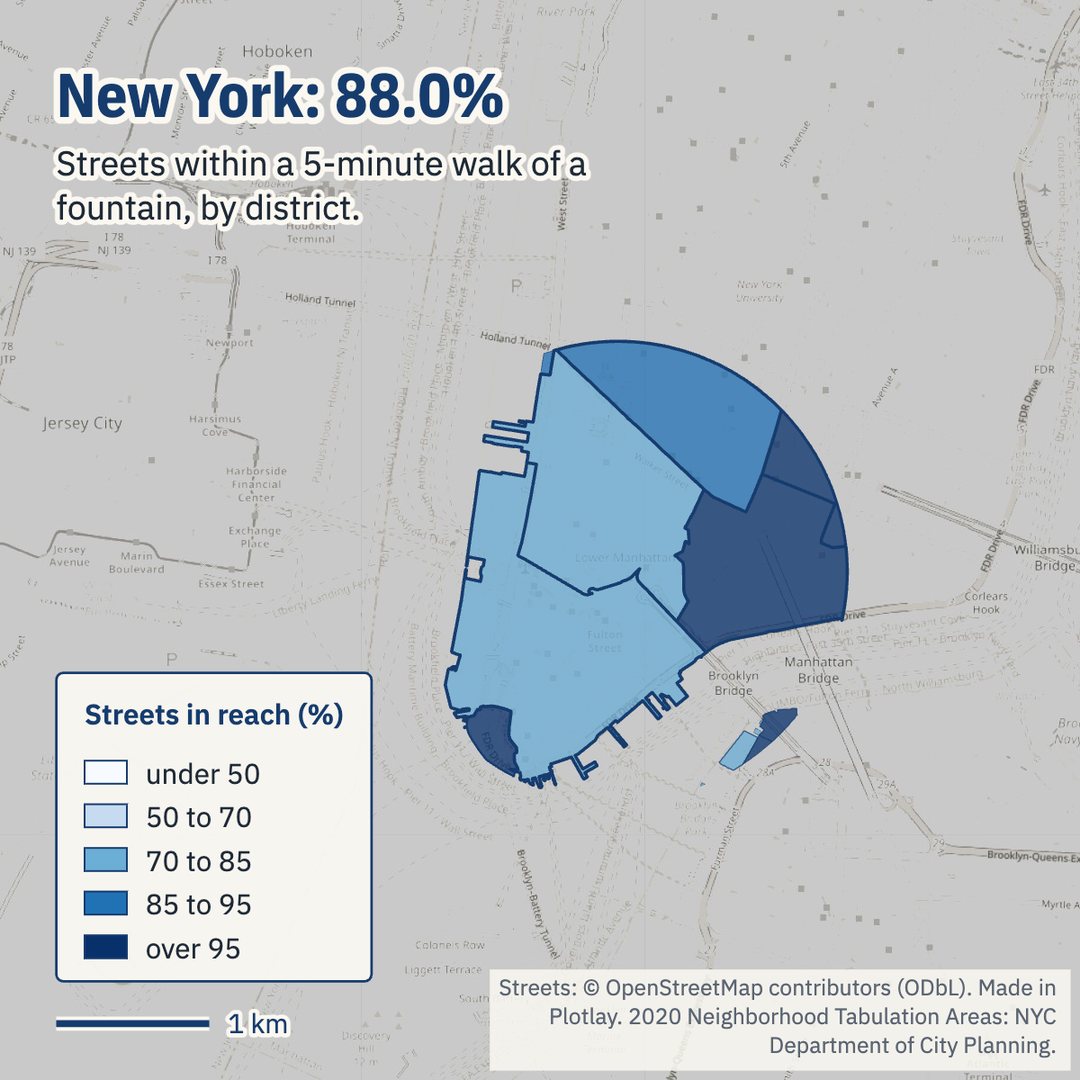
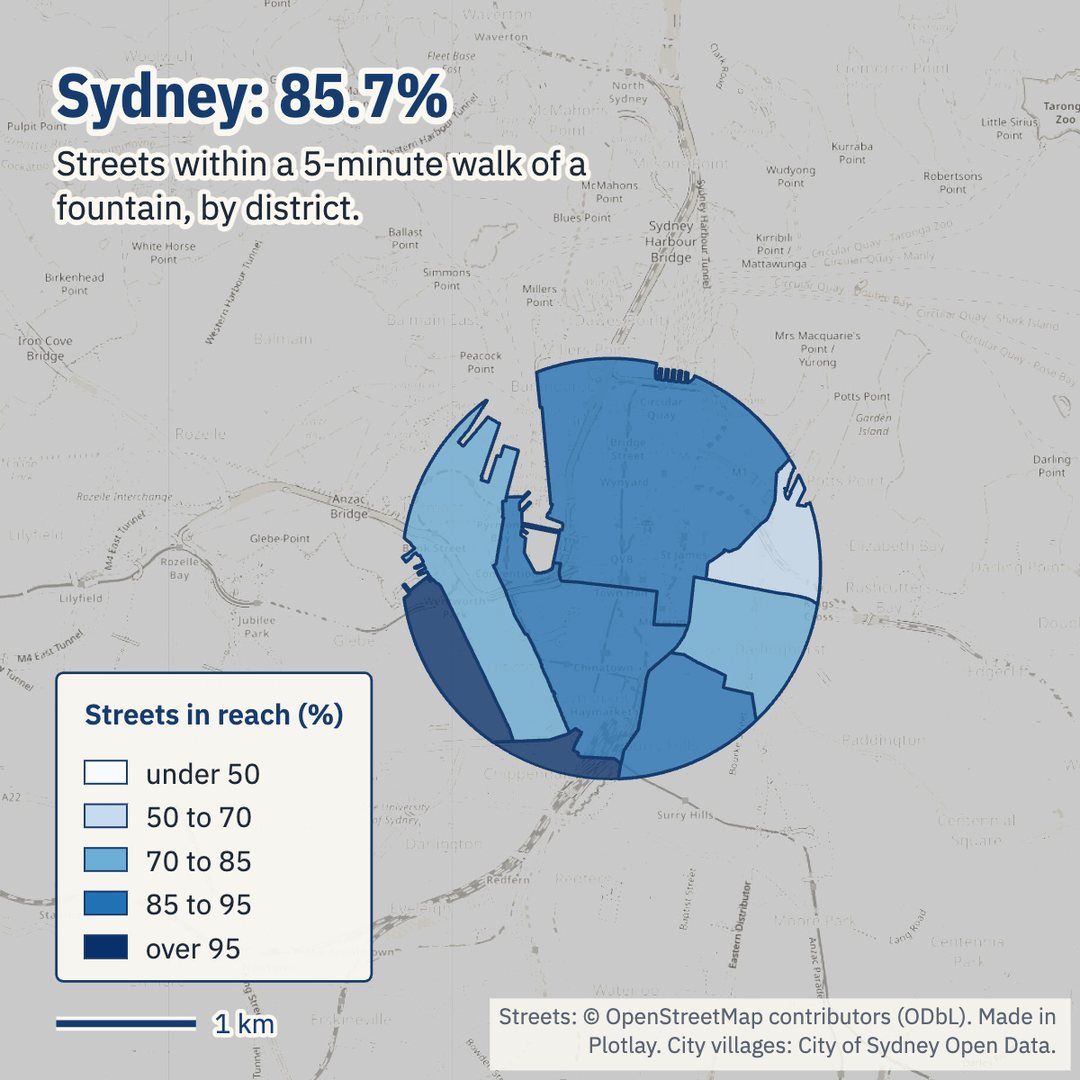
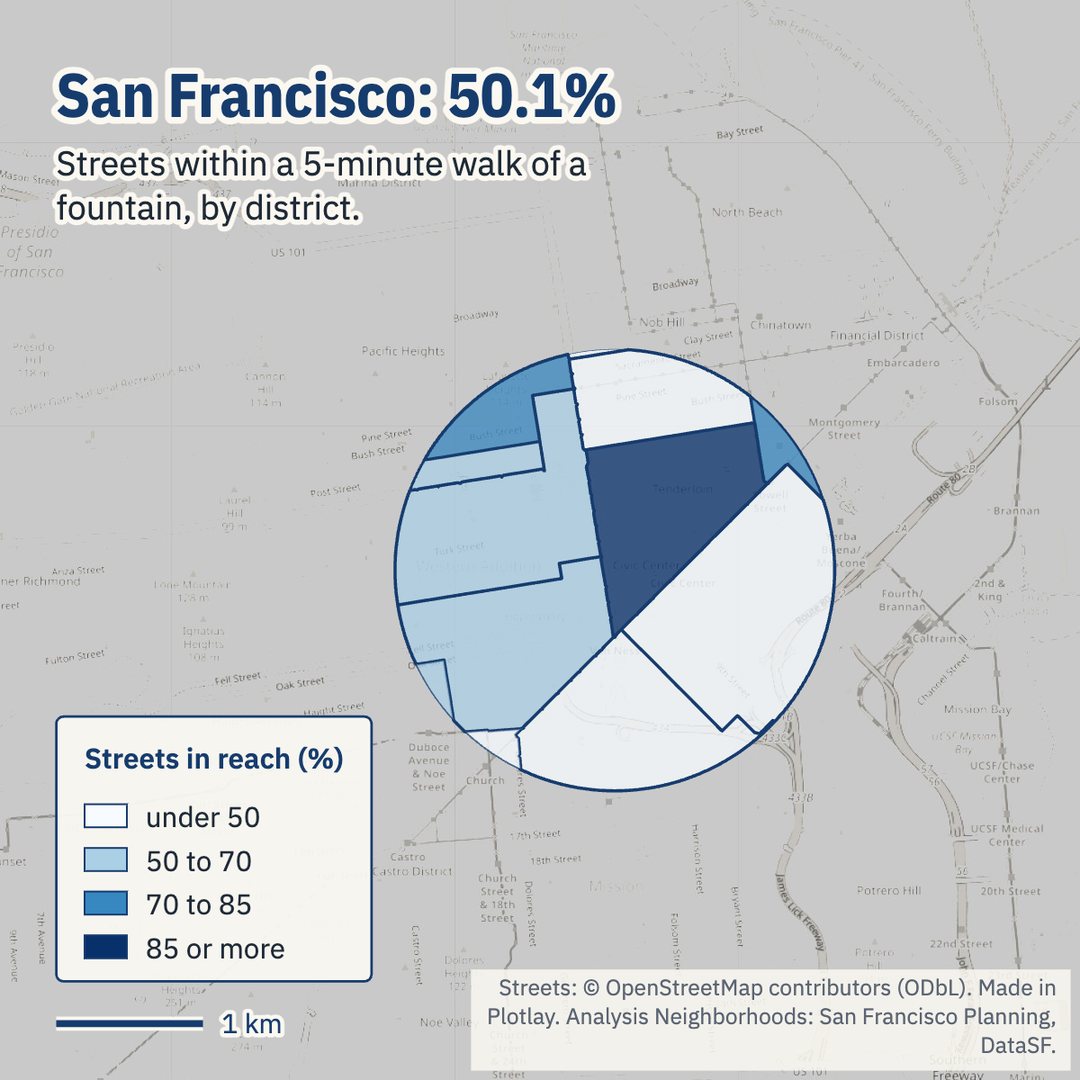
Each city’s districts, coloured by the share of their streets within a 5-minute walk of a fountain: map pictures made in Plotlay’s Analysis workspace. Under 50% pale, 95% or more dark blue.
Where the gaps are
In Sydney, Macleay Street & Woolloomooloo has 65.4% of its streets in reach, with 1 fountain in the council’s list. In Paris, Palais-Royal has 36.8% and no fountain in its part of the study area. In New York, the Financial District-Battery Park City district reaches 79.8%.
Residents. Weighting each 100 m square of the European Commission’s population grid by the share of its streets in reach, 99.7% of Rome’s central residents live within a 5-minute walk of a fountain, 99.5% of Melbourne’s and 62.4% of San Francisco’s. San Francisco’s residents are better served than its streets because the Tenderloin, the most crowded district in its study area, has 8 fountains, as many as any district there.
How sure is it?
OpenStreetMap is a check on each city’s list: an official fountain counts as matched when OpenStreetMap has a drinking water point within 30 m of it.
| City | Fountains from | Licence | In the study area | OpenStreetMap points | Matched in OpenStreetMap |
|---|---|---|---|---|---|
| Melbourne | City of Melbourne, Drinking fountains | CC BY 4.0 | 122 | 133 | 84% of 122 |
| Sydney | City of Sydney, Drinking fountains (water bubblers) | CC BY 4.0 | 84 | 136 | 77% of 84 |
| New York | NYC Parks Drinking Fountains | NYC Open Data, no restrictions on use | 95 | 98 | 60% of 95 |
| San Francisco | SFPUC, Public Bathrooms and Water Fountains (DataSF) | PDDL 1.0 | 26 | 12 | 35% of 26 |
| Paris | Eau de Paris, Fontaines à boire | ODbL 1.0 (share-alike) | 103 | 114 | 82% of 103 |
| Barcelona | Ajuntament de Barcelona, Fonts de beure | CC BY 4.0 | 180 | 180 | 93% of 180 |
| Rome | OpenStreetMap, amenity=drinking_water | ODbL 1.0 (share-alike) | 210 | 210 | 85% of the city geoportal’s 217 |
Barcelona’s list and OpenStreetMap agree on 93% of fountains; New York’s on 60% and San Francisco’s on 35%. Measured with OpenStreetMap’s points instead, Sydney rises from 85.7% to 95.9% (it maps fountains in the state’s precincts too) and New York from 88.0% to 97.1%, while San Francisco falls to 35.9%: there OpenStreetMap has fewer fountains than the city’s list. For Rome, 85% of the city geoportal’s 217 nasoni match an OpenStreetMap point; its geoportal is used only for that count.
How it was made in Plotlay
- A map project and a Districts data layer: each city’s district file taken all at once (Take all), keyed by its own code, with its licence.
- Cities: the seven study areas, 1.5 km round each city hall inside its districts, with the city results linked by key.
- Fountains as points: each city’s list taken all at once into its own layer, every fountain keyed by its code.
- Walking catchments on the Shapes tab: 5 minutes at 4.8 km/h, Count: streets only, within: Districts. One request for OpenStreetMap’s walkable streets and paths; each fountain’s walk along them; every district gets the share of its street length in reach.
- Colour the districts by that share, by hand at 50, 70, 85 and 95%.
- Charts and map pictures in the Analysis workspace: the ranking and each city’s districts, exported as PNG.
- Export GeoJSON, TopoJSON for the Power BI Shape Map, CSV with WKT and the linked data.


Why streets only. Central Melbourne maps most footpaths in OpenStreetMap as ways of their own beside the street, so counting every walkable way would count its streets two or three times: 375.6 km of ways against 153.2 km of streets. Streets only counts roads and pedestrian streets along their centrelines, the same way in every city, while the walk still uses every footpath, lane and set of steps.
More about Data layers · Make a data layer of your own
Power BI
The same tables as a Power BI Project (.pbip): the seven cities ranked, a Shape Map of the districts keyed by their code with a city slicer, and the fountains on Azure Maps, with the Plotlay theme. It reads the data from the GitHub repository, so it refreshes with no gateway. It is in the plotlay-drinking-fountains repository on GitHub, with the steps to open it.
Python
A narrated Jupyter notebook reads the tables and shapes, recomputes the city and district shares from the street lengths, and maps the districts and fountains.
Download the notebook (with its outputs) and the data. Both are also in the repository on GitHub.
Read it carefully
- Each city records different things. New York’s list is parks only; Sydney’s is the council’s own; Melbourne counts each bottle refill tap as its own record; Barcelona’s list has no field for park or status. A low share can mean few fountains or a short list.
- Winter. Many fountains in New York and the European cities are turned off over winter. These shares count every fountain as on: they describe the summer network. Paris’s list marked 9 of the 133 fountains used here unavailable on the day it was downloaded; without them Paris has 94.0%.
- Park and indoor fountains. Indoor fountains are left out everywhere they can be told apart. Fountains inside parks count, and a park’s paths are walked along, but only streets are counted.
- The study area. 1.5 km round each city hall, inside the city’s own districts: water, and land outside Melbourne’s and Sydney’s council areas, drop out. Fountains up to 400 m outside count, as they serve streets inside.
- The streets. OpenStreetMap’s walkable network, as of 2026-11-08. A fountain joins it at the nearest junction or bend; streets mapped with no foot access are not walked. Accuracy depends on how well each city is mapped.
- Residents are modelled. The GHS-POP grid (2020) spreads census counts over buildings, so a district’s residents are an estimate. Districts under 0.1 km² inside the study area are left out of the text.
Other showcases
- Melbourne’s trees and their shade: how much of the City of Melbourne’s canopy ends with the trees’ useful lives.
- Twenty years of street trees: New York City’s three street tree censuses, neighbourhood by neighbourhood.
- Melbourne’s pedestrian counts: where people walk in the city, hour by hour.
Sources and licences
Fountains: City of Melbourne Open Data, Drinking fountains (CC BY 4.0); City of Sydney Open Data, Drinking fountains (water bubblers) (CC BY 4.0); NYC Parks Drinking Fountains, NYC Open Data (published “without any registration requirement, license requirement or restrictions on their use”, NYC Administrative Code 23-502); San Francisco Public Utilities Commission, Public Bathrooms and Water Fountains, DataSF (PDDL 1.0); Eau de Paris, Fontaines à boire, Paris Data (ODbL 1.0, share-alike); Ajuntament de Barcelona, Fonts de beure, Open Data BCN (CC BY 4.0). Rome: OpenStreetMap drinking water points; Roma Capitale’s geoportal layer of fontanelle has no open licence and was used only for the match count.
Districts: City of Melbourne, CLUE small areas (CC BY 4.0); City of Sydney, City villages (CC BY 4.0); NYC Department of City Planning, 2020 Neighborhood Tabulation Areas (NYC Open Data); San Francisco Planning, Analysis Neighborhoods (PDDL 1.0); Ville de Paris, Quartiers administratifs (ODbL 1.0); Ajuntament de Barcelona, Barris (CC BY 4.0); Rome’s rioni from OpenStreetMap.
Streets, Rome’s fountains and rioni: © OpenStreetMap contributors, ODbL 1.0. Residents: Schiavina M., Freire S., Carioli A., MacManus K. (2023): GHS-POP R2023A, GHS population grid multitemporal (1975-2030). European Commission, Joint Research Centre. Changes: fountains filtered as described, districts clipped to the study areas, the population grid cut by district.
Because the street network, the Paris data and Rome’s fountains are under the ODbL, the tables and shapes in the repository are under the ODbL too; the visuals are CC BY 4.0 with the same credits, and the code is MIT. This is independent work using open data, not endorsed by any of the cities.
Measure your own walking catchments
Plotlay is free to start: every tool, three cloud projects.
Create free accountThen open Data layers in any map project