
Learn · Field and asset teams · Lesson 6 of 6
Export to GIS, Excel or Power BI
You willDownload your assets and shapes as GeoJSON, a Shapefile or a CSV, ready for a GIS or a spreadsheet.
Time3 min
Try it in Plotlay → Opens an example project with this lesson beside it. Nothing to install.
Steps
- Choose Export in the top bar (Ctrl+E), then GIS data.
- Under Shapes, choose the coordinates: Latitude / longitude (WGS 84) for most GIS and Power BI maps, or UTM metres for engineering work.
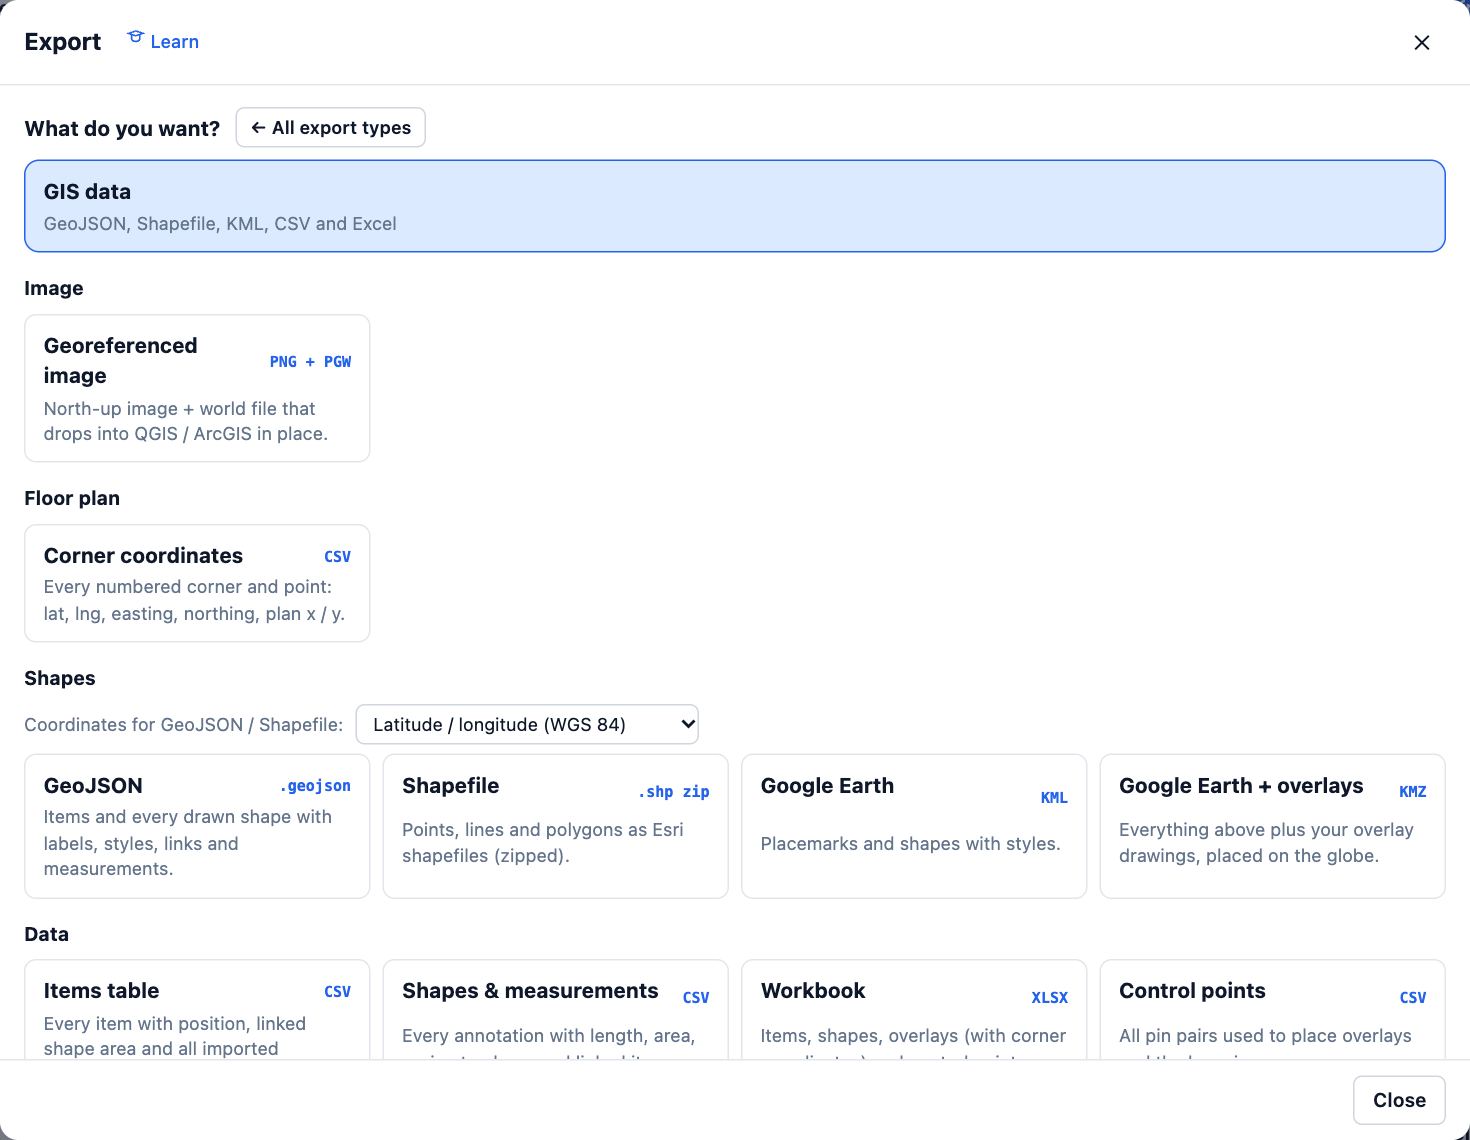
- Choose GeoJSON for QGIS, ArcGIS Online or web maps, or Shapefile for older desktop GIS. Each downloads straight away.
- For a spreadsheet or Power BI, choose Items table: every asset with its position and all its imported columns.
- After an audit, Field audit pack zips the status, condition, notes, GPS accuracy and every site photo with a GeoJSON of the positions.
Tips
- Shapes carry their linked asset’s columns, so they join straight onto an asset register in a GIS.
- In QGIS, drag the downloaded file onto the map: it lands in place.
Common mistakes
- Opening a Shapefile zip without unzipping it: some programs need the files extracted first.
- Mixing coordinate systems: keep latitude and longitude unless your GIS project is in UTM.
Related lessons
Work through an asset register on siteVisit each asset in turn, nearest first, and record where it is, its form answers or that it is missing.5 minSet up asset formsChoose the questions to answer about each kind of asset on site, with required answers and photos.4 minIssue a drawing setMake one numbered PDF of plans, elevations, 3D views and schedules with your title block.4 min
Steps checked in the app on 14 October 2026.